Drought Expansion Likely in Europe to the Black Sea Region for the 2025 Warm Season
03/18/2025, 4:21 am EDT
Soaking Wet Australia Pattern Ahead!
03/20/2025, 8:05 am EDT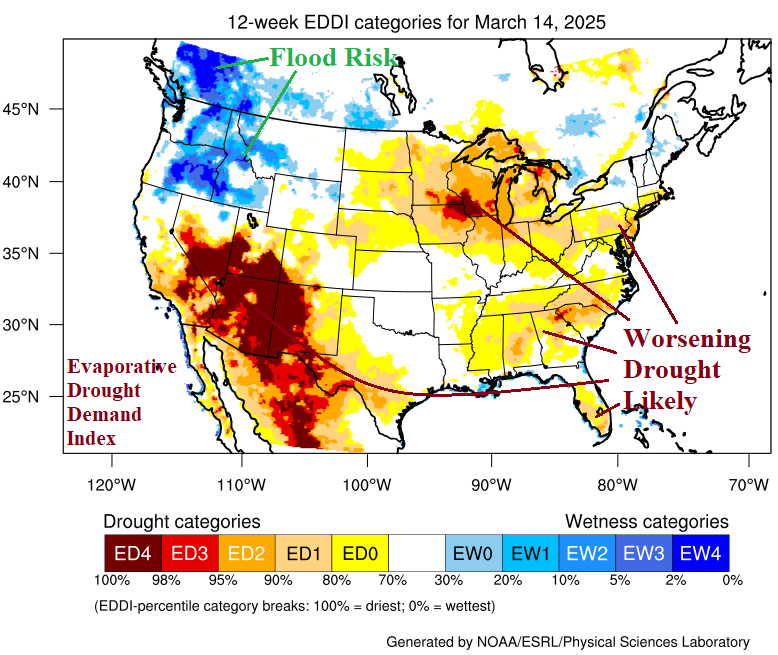
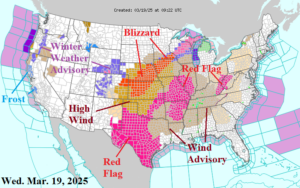
Fig. 1: Latest NOAA/NWS weather watch, warning, and advisory areas.
Discussion: A gigantic swath of high wind and attendant Red Flag Warnings are issued this morning (Fig. 1) extending from the Great Plains and Texas to the Ohio and Tennessee Valley(s). While severe thunderstorms including tornado risk are focused on Illinois today, the focus of the morning report is on dry soil and drought risk. The expansive high wind event is extremely effective at drying soil (other than the very confined area of rainfall associated with severe weather). The evaporative drought demand index (EDDI) is highlighting the Midwest, Southeast, and Southwest as areas of potential drought development or strengthening of existing drought (Fig. 2). In these areas, the “thirst” for precipitation, due to the long-term climate is increasing. During the warm season, ED3 and ED4 areas are susceptible to flash drought and recently have been identified as excellent predictors of high fire risk. During the spring season, NOAA is forecasting an unusually large area of fire risk focused on Texas and New Mexico and the Southeast U.S. (Fig. 3). The U.S. precipitation outlooks through the next 15 days (Fig. 4) and 16-30-day period (Fig. 5) each feature unwanted dry risk for much of the southern half of the U.S. The latest U.S. population weight HDD forecast reveals a cooler trend since 72 hours ago toward normal national heating demand to close March and start April (Fig. 6).

Fig. 2: The latest evaporative drought demand index analysis identifying areas susceptible to drought and flood risk.
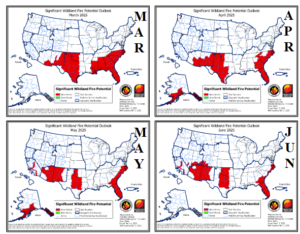
Fig. 3: The NOAA March through June 2025 high fire risk areas of the U.S.
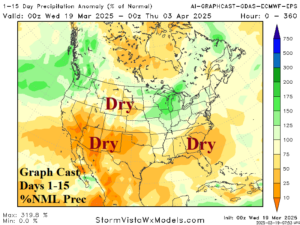
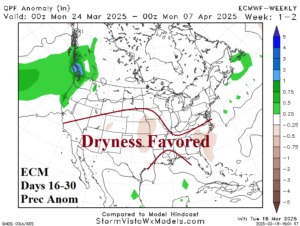
Fig. 4-5: Graph Cast 15-day percent of normal precipitation forecast and the ECM 16-30-day precipitation anomaly forecast.
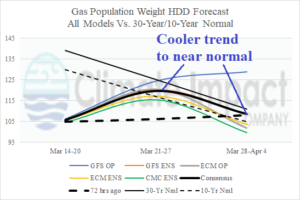
Fig. 6: The late season U.S. population weight HDD forecast utilizing all operational models, their consensus, and comparing with 72 hours ago plus the 30-year/10-year normal.