An Update on North Atlantic Hurricane Forecast Factors
09/03/2024, 4:35 am EDT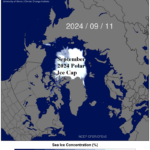
The Likelihood of Abundant Northern Hemisphere Early Season Snow Cover
09/21/2024, 9:03 am EDT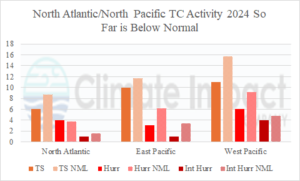
Fig. 1: Tropical cyclone activity in the North Atlantic and North Pacific in 2024 so far compared to normal.
Discussion: Each tropical cyclone basin in the North Atlantic and North Pacific has generated below normal tropical cyclone activity so far in 2024 (Fig. 1). The North Atlantic has produced just 6 tropical storms compared to almost 9 given the 30-year normal for September 13th. Hurricanes in the North Atlantic so far (4) is exactly normal. The Northeast Pacific is notably behind in number of hurricanes (3) compared to the 30-year normal (6.2). Additionally, by September 13th 3 or 4 intense hurricanes have formed in the Northeast Pacific with only one generated in 2024 so far. Normally, if one side of the Pacific is less active than normal, the opposite side is busy. However, in 2024 so far, the Northwest Pacific has observed 6 hurricanes compared to the 30-year normal which is 9. The most notable statistic citing below normal tropical cyclone activity is the accumulated cyclone energy index (Fig. 2) of only 53 in the Northeast Pacific compared to the 30-year normal (94.6). More impressive is the ACE index of only 87.6 in the Northwest Pacific compared to the 30-year normal of 158.1. Despite the low amounts of storms, the North Atlantic basin ACE index was above normal until recently at 58.1 compared to the 30-year normal of 64.8.
The below normal activity in each basin is unusual. The reasons for the below normal activity are under review. In the Northwest Pacific, high-level above normal westerly wind shear across the tropics has limited hurricane development (Fig. 3) while stronger than normal low-level trade winds have suppressed activity in the deep tropics of the Northeast Pacific and North Atlantic (Fig. 4).
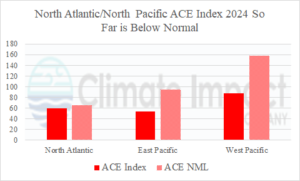
Fig. 2: Accumulated cyclone energy (ACE) index in the North Atlantic and North Pacific in 2024 so far compared to normal.
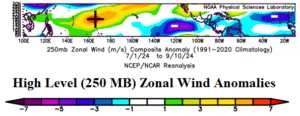
Fig. 3: The high level (250 MB) zonal wind anomalies across the northern hemisphere tropical oceans.
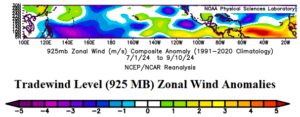
Fig. 4: The trade wind level (925 MB) zonal wind anomalies across the northern hemisphere tropical oceans.