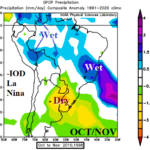
-IOD/ENSO Regimes across South America for OCT/NOV and DEC/JAN
08/09/2024, 4:15 pm EDT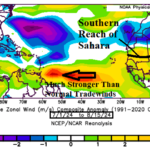
Fast Trade Winds Preventing Very Active North Atlantic TC Regime
08/18/2024, 9:39 am EDT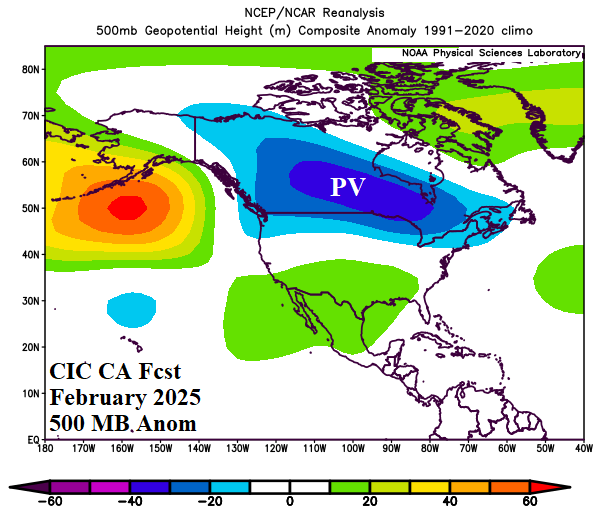
Executive summary: Based on a constructed analog combining optimum climate normal and ENSO analog years the upper air pattern for North America for each month of meteorological winter 2024-25 is projected. Revealed is low risk of a “polar vortex” pattern during December or January. However, a broad polar vortex pattern is forecast across Southern Canada during February. Significant cold (arctic air) is below normal risk for December and January although mid-winter should be cold and snowy in the West. Arctic air becomes intense in Canada later this winter season with brief deep southern latitude exposure and most effective across Northern U.S. snow cover.
Discussion: During the middle 1990’s the long-term (2-4-decade) cycle of the El Nino southern oscillation (ENSO), Pacific decadal oscillation (PDO), and Atlantic multi-decadal oscillation (AMO) changed phase. One side-effect of the (+AMO) cycle change was a warming in the northern North Atlantic associated with the warmer Gulf Stream. The persistent warming of the northern oceans during the winter season warmed the atmosphere aloft causing a semi-permanent high pressure to form over Greenland (Fig. 1) commonly referred to as a blocking pattern or negative phase of the North Atlantic oscillation (-NAO).
After 18 winter seasons (1995-96 through 2012-13) of this semi-permanent upper air pattern in the northern hemisphere winter, a dramatic change occurred in 2013-14. Without explanation a large area of oceanic warming extending from the surface to 300-meter depth in the northeast Pacific formed and during the next 2-3 years strengthened and advanced to the North America West Coast ultimately contributing to one of the strongest El Nino’s on record in 2015-16. The warming northeast Pacific was so intense that aloft, the atmosphere warmed creating an amplified high-pressure ridge. During the winter of 2013-14 and 2014-15 the upper ridge was so intense that a “ridge bridge” pattern extending across Alaska formed and caused a compensating downstream amplified low-pressure trough over Canada famously referred to as the winter polar vortex pattern of winter 2013-14 and 2014-15. The large area of oceanic warming, known as a marine heatwave (MHW) became semi-permanent.
At the same time, during the warmer-than-normal North Atlantic basin regime which began in the middle 1990’s, a cool pool of water formed south and southeast of Greenland. The cool pool was a large area of stratified cooler than normal water collecting in this location due to the increased runoff of snow and ice melt from the Greenland icesheet likely related to the warm semi-permanent high-pressure area in this region from the previous 18 years. The cooling water area south of Greenland, surrounded by the warmer than normal North Atlantic due to the +AMO decadal cycle change that began in the late 1990’s became known as the North Atlantic warm hole (NAWH). Aloft, a semi-permanent low-pressure area formed near the NAWH and has persisted in this location for the past 11 years (Fig. 2).
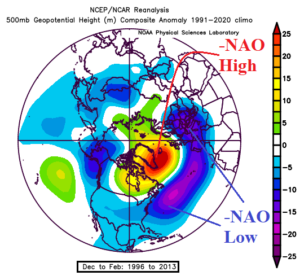
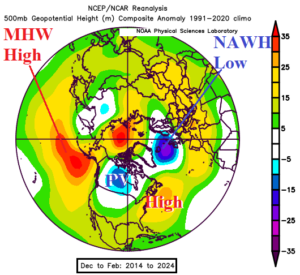
Fig. 1-2: The persistent 500 MB anomaly pattern during DEC/JAN/FEB 1995-96 through 2012-13 followed by a semi-permanent change during winter 2013-14.
Note the tendency for a warmer than normal winter with the upper air pattern change in 2013-14 to present vs. the winter temperature anomalies during the winter 1995-96 through 2012-13 (Fig. 3-4). The temperature patterns indicated are consistent and referred to as an optimum climate normal (OCN) and applied to any climate forecast prior to considering ENSO phase.
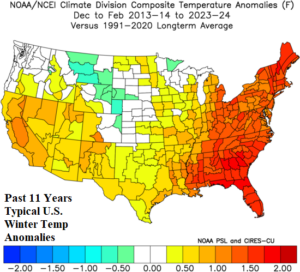
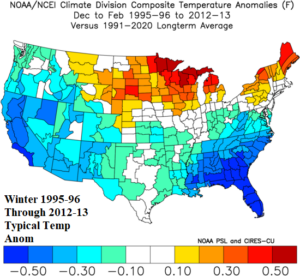
Fig. 3-4: The typical U.S. temperature anomalies during winter of the past 11 years compared to wintertime 1995-96 to 2012-13.
During winter 2024-25, ENSO is forecast to shift into a weak La Nina. Using multi-variate ENSO index (MEI) to determine analog years which began the year in El Nino and shifted into weak La Nina by the end of the year in the modern climate era (since the middle 1990’s) we find that 1995-96, 2006-07, and 2016-17 are reasonable. Other El Nino to La Nina shifts in 1998-99 and 2010-11 were too strong. Combining OCN and the 3 analogs is a simple but perfectly reasonable approach to estimate the polar vortex presence and intensity for the upcoming 3 months of meteorological winter.
Will a polar vortex pattern appear during the North America winter 2024-25 season? The constructed analog forecast indicates low risk of a classic polar vortex during DEC-24 and JAN-25 (Fig. 5-6). In December, a strong low-pressure area forms off the Canadian Maritime Coast while a weak polar vortex pattern may be present at times in Western Canada. However, for the U.S., this is a mild pattern to start meteorological winter. During JAN-25, a stormy low-pressure trough drops anchor on the West U.S. causing snow and cold in that region while east of the Continental Divide, the pattern is mild for mid-winter. Storminess is stronger than normal along the U.S./Canada border in December and across the West and Central U.S. during January.
In February, a polar vortex appears, stretched out across Southern Canada (Fig. 7). The upper air projection does not indicate a “ridge bridge” across Alaska toward Siberia therefore cross-polar flow of arctic air is possible but below normal risk in this depiction. Favored in an upper air forecast of this character is a home grown strong polar air mass gradually becoming arctic in intensity. Presence of an upper ridge over Mexico to Texas indicates southward penetration of cold air to the lower latitudes is brief. Meaningful cold air presence and expansion is most likely across Northern U.S. snow cover. In this upper air pattern, New England gains snow cover (and attendant cold) after lack of snow for the first 2/3 of the winter season.
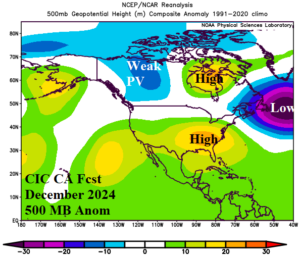
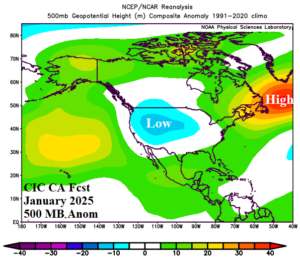

Fig. 5-7: The Climate Impact Company constructed analog 500 MB anomaly forecast to determine presence of the polar vortex for DEC/JAN/FEB 2024-25.