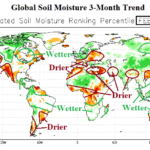
Global Soil Moisture Observation Trend/Forecast
03/06/2025, 1:45 pm EST
February 2025 and DEC/JAN/FEB 2024-25 U.S. State Temperature and Precipitation Rankings
03/11/2025, 9:07 am EDT
| Basin (Normal) | Tropical Storms | Hurricanes | Intense Hurricanes | ACE Index |
| South Indian (west of 135E) | 17 (12.0) | 11 (6.3) | 8 (3.4) | 176.9 (93.5) |
| South Pacific (East of 135E) | 7 (6.9) | 3 (3.3) | 1 (1.8) | 36.1 (50.9) |
| Southern Hemisphere
| 24 (18.9) | 14 (9.6) | 9 (5.2) | 213 (144.9) |
Table 1: Southern hemisphere tropical cyclone activity for the 2024-25 tropical cyclone season compared to 30-year normal. Source: Colorado State University.
| Feature | Results |
| Peak strength | Category-4 Major Hurricane |
| Maximum wind | 150 KM/HR (93 mph) Frederick Reef |
| Max Mainland Gust | 120 KM/HR (75 mph) Byron |
| Max Gust | 230 KM/HR (143 mph) |
| Highest Rainfall | 1,111 MM (43.7 in.) Springbrook |
Table 2: Impacts of Category-4 Major Hurricane Alfred in Australia. Source: Weatherwatch.
Discussion: As former Category-4 Major Hurricane Alfred has weakened, a review of the southern hemisphere tropical cyclone activity reveals MUCH ABOVE activity west of 135E in the Southern Indian Ocean while waters to the east of 135E were near normal (Table 1). The ACE index in the Southern Indian Ocean was nearly double normal amount. Warmer than normal SST were a catalyst to the very active season. Alfred is the only major hurricane in the South Pacific where the ACE index is 36.1 or about 72% of normal. According to Weatherwatch, tropical cyclone features of Alfred included an estimated maximum wind gust of 143 mph and maximum mainland sustained wind of 75 mph responsible for a widespread and massive loss of power (Table 2).
The Madden Julian oscillation (MJO) has been very active during DEC/JAN/FEB 2024-25. Another pulse of the convection phase of MJO is forecast to emerge this week in the Indian Ocean and shift eastward to the north of Australia next week (Fig. 1). The shift to waters northwest and north of Australia increases the risk of a very wet pattern including tropical cyclone risk on the Australia North Coast and attendant rainfall spreading southward (Fig. 2).
If the convection phase of the MJO reaches phase_4/phase_5 with intensity, the 8-14-day forecast for South America, particularly Brazil will trend drier than the wet outlooks of recent days for that timeframe. The ECM ENS 24-hour change is much drier (Fig. 3) while Graph Cast is already drier than normal (in the 8-14-day period) for Brazil (Fig. 4).
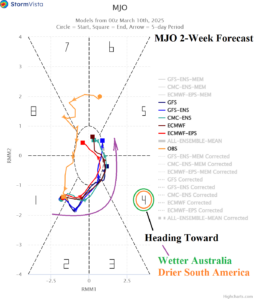
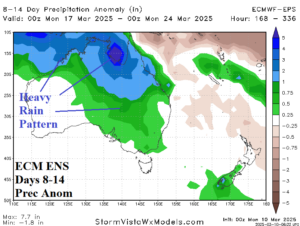
Fig. 1-2: Madden Julian oscillation 14-day forecast and ECM ENS rainfall anomaly outlook for days 8-14 in Australia.
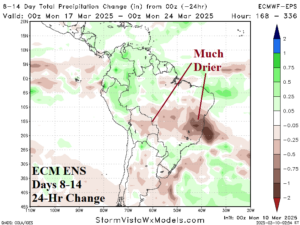
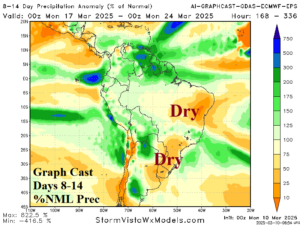
Fig. 3-4: The ECM ENS 8-14-day 24-hour rainfall amount forecast change and AI Graph Cast rainfall anomaly outlook for the same time.