Madden Julian Oscillation Eastward Shift Should Break East U.S. Cold
01/16/2025, 8:38 am EST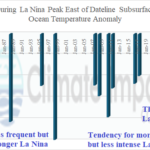
Subsurface Moderately Cold in Equatorial East Pacific as La Nina Likely to Linger well into NH Spring
02/02/2025, 9:44 am EST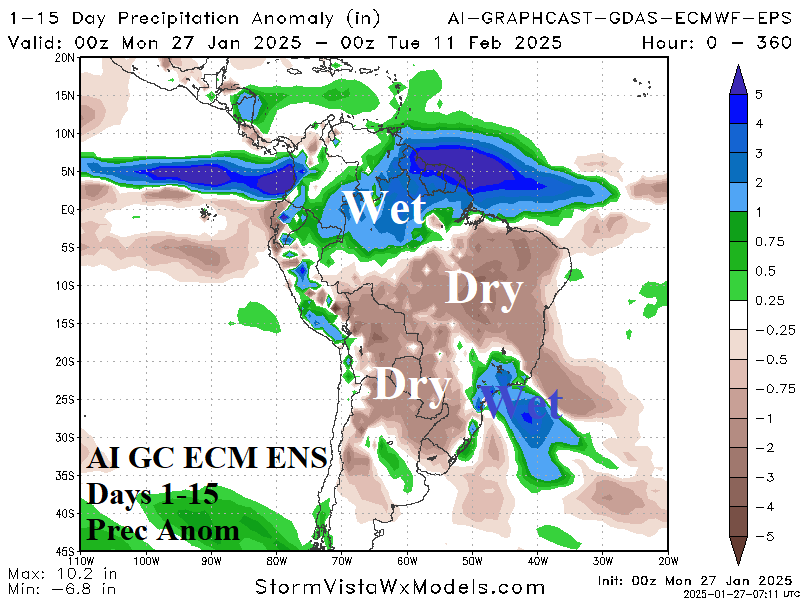
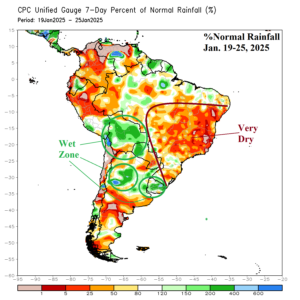

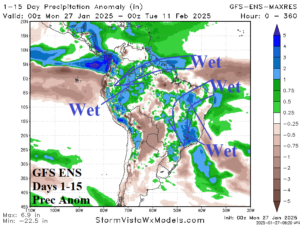
Fig. 1-3: Last week’s percent of normal rainfall observations across South America and the 15-day percent of normal rainfall forecast from using GFS ENS and AI Graph Cast ECM ENS.
Discussion: During the past 7 days, the rainfall pattern across central and eastern Brazil was very dry while patchy heavy thunderstorms were observed over Bolivia, West Paraguay, and Northern Argentina (Fig. 1). A pattern change is forecast for late January/early February as East Brazil turns wet again. The GFS ENS identifies two areas of wet weather across the northern half of South America in the 15-day forecast. Wet easterly trade winds bring heavy rains to Interior Northwest South America and while an upper trough inspires wet weather across Eastern Brazil (Fig. 2). The dynamics to support the wet weather forecasts are reasonable and important to note, given the very wet bias all forecast models have shown in 15-day forecasts throughout the summer season. By contrast, the AI Graph Cast ECM ENS is much drier for Central and East Brazil (Fig. 3). The data feeding the AI algorithm is from years prior to the last 2 years therefore not accounting for the current wet bias. The AI forecast is similar in theme to drier climate forecasts for Northern Argentina to Eastern Brazil for mid-to-late calendar summer.