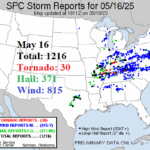
Brief Review of the May 15-16 U.S. Severe Weather Event
05/18/2025, 7:29 pm EDT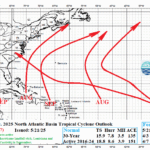
Near Normal TC Activity in 2025. But! 7 Hurricanes Indicate Dangerous Season
05/21/2025, 8:16 am EDT![]()
Climate Impact Company Daily Feature
Issued: Tuesday, May 20, 2025
Highlight: North Atlantic Warm Hole Forming; Implications?
Discussion: The mid-latitude mid-to-late May 2025 upper-level low-pressure troughs, most prominent across the East U.S., are the result of high latitude high pressure blocking (also) causing unusually warm surface temperatures which are accelerating polar ice melt including the Greenland icesheet. The freshwater runoff is creating a stratified cool layer of water at the surface south of Greenland as the North Atlantic warm hole (NAWH) is developing (Fig. 1). To compensate, waters off the West Coast of Europe are warming as a marine heatwave (MHW) is forming. The 30-day SSTA changes identify the speed of development of each oceanic feature (Fig. 2). ECMWF global SSTA forecasts identify the NAWH development (and the compensating MHW) with intensification into mid-summer (Fig. 3). The NAWH pattern which is present most prominently during the warm season became semi-permanent in 2014 and redeveloped each year through 2018 similar with the JUL-25 (ECMWF) forecast. The NAWH pattern has been weaker during the past 6 years. The effect on the summertime upper air pattern is profound as the cool atmosphere above the NAWH forces formation of a semi-permanent upper-level low-pressure trough compensated by a downstream upper-level high-pressure ridge over Europe (enhanced by the warming influence of the MHW) and an upstream ridge across northeastern North America (Fig. 4). The Europe ridge increases drought risk while the Northeast Canada ridge became famous for causing tropical cyclones to stall and flood Texas (Harvey in 2017) and North Carolina (Florence in 2018). The prevailing upper air pattern biases both the U.S. and Europe hotter than normal during JUL-SEP (Fig. 5) with attendant rainfall regimes enabling intense dryness over France and Ukraine (and vicinity) while the coastal U.S. is susceptible to stalling tropical cyclones (Fig. 6). Implied is a return to the 2014-18 NAWH ocean and atmosphere climatology for the upcoming summer season!
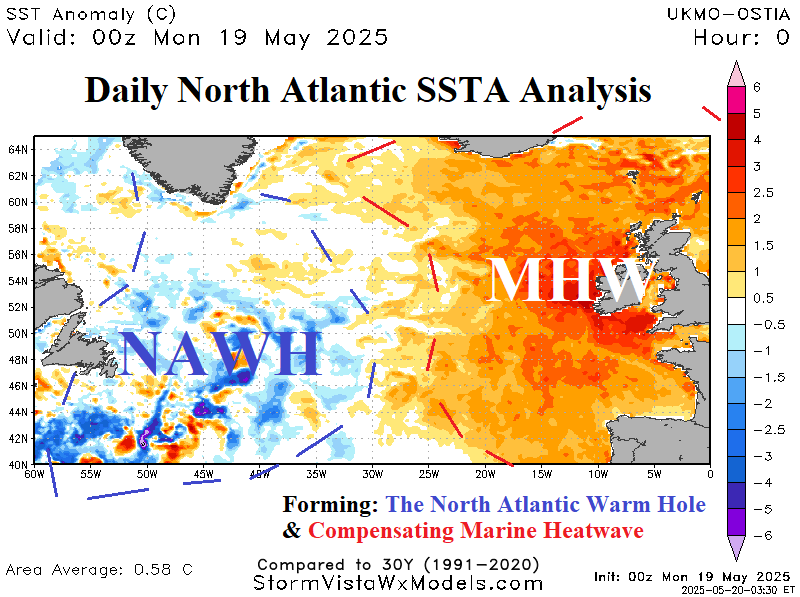
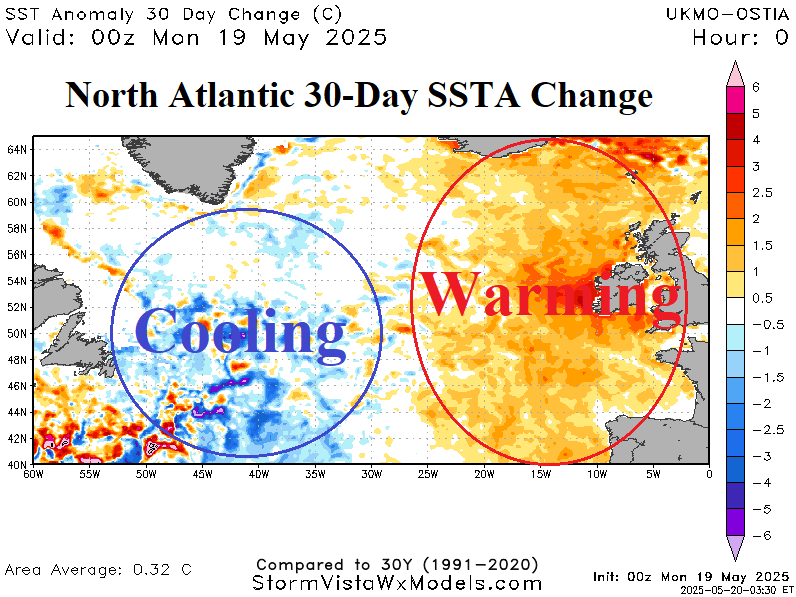
Fig. 1-2: Daily SSTA analysis reveals formation of the North Atlantic warm hole and a compensating marine heatwave with 30-day SSTA change (also) indicated.
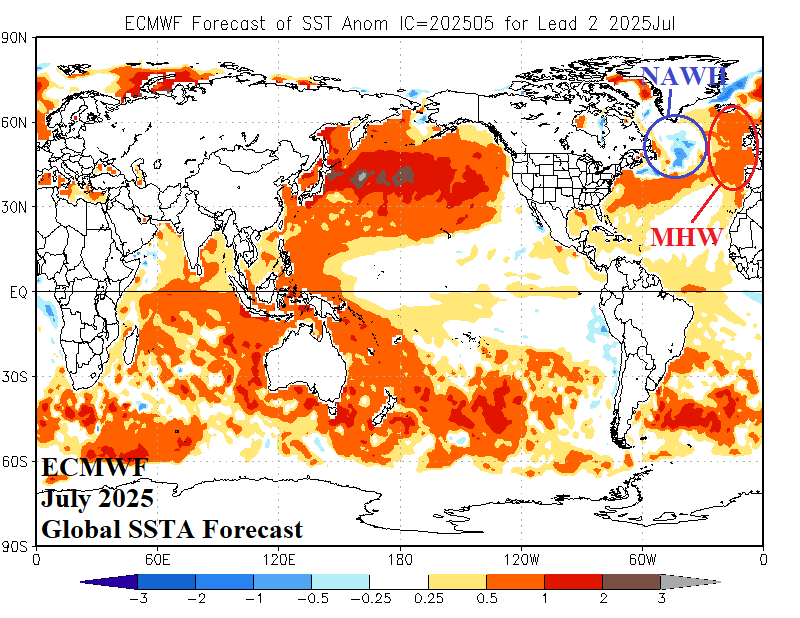
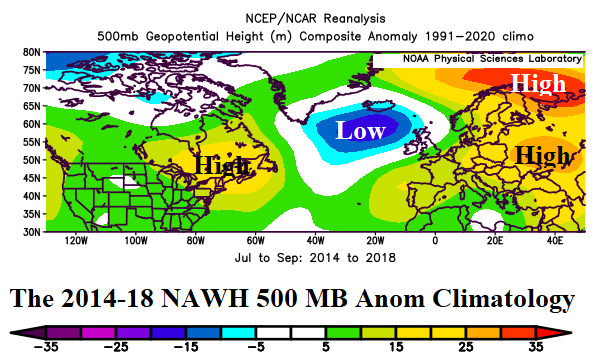
Fig. 3-4: ECMWF SSTA forecast for JUL-25 reveals strengthening of the NAWH/MWH pattern in the North Atlantic. When this pattern was present during 2014-18, the prevailing JUL-SEP upper air pattern produced low pressure near the NAWH with compensating upstream/downstream high pressure ridge areas.
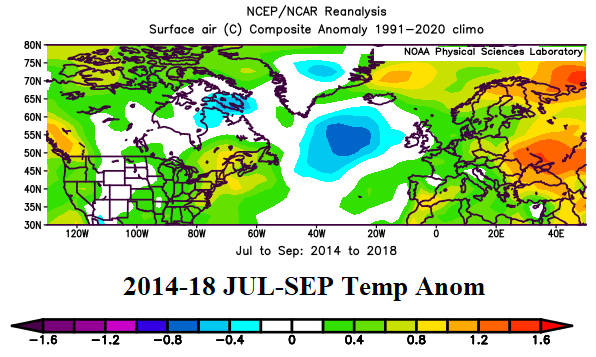
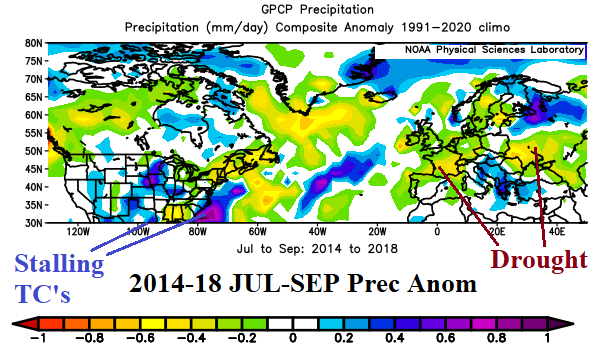
Fig. 5-6: The prevailing temperature and precipitation anomalies caused by the NAWH pattern during 2014-18 for JUL-SEP.