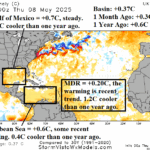
Latest North Atlantic Basin SSTA Analysis
05/12/2025, 9:21 am EDT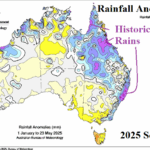
Marine Heatwaves Fueling Historic Australia Rains in 2025
05/23/2025, 5:08 am EDT![]()
Climate Impact Company Daily Feature
Issued: Sunday, May 18, 2025
Highlight: Review of the May 15-16 U.S. severe weather event.
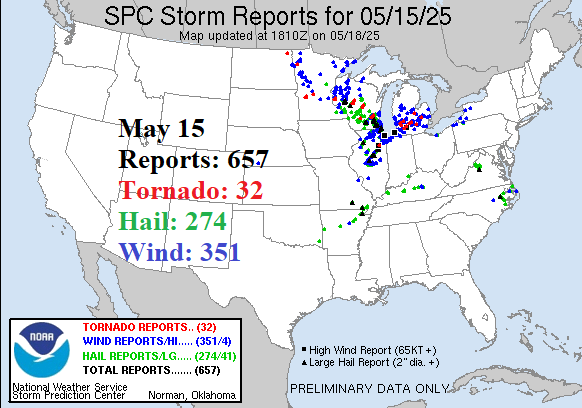
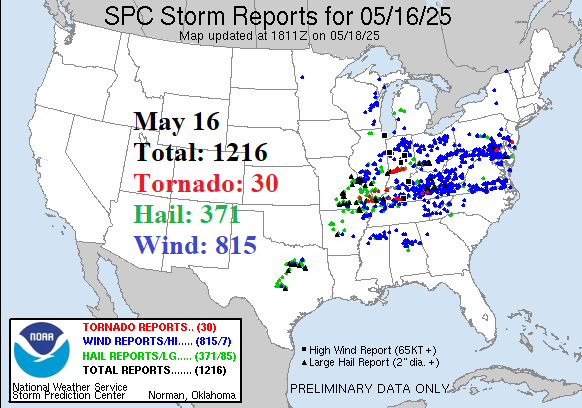
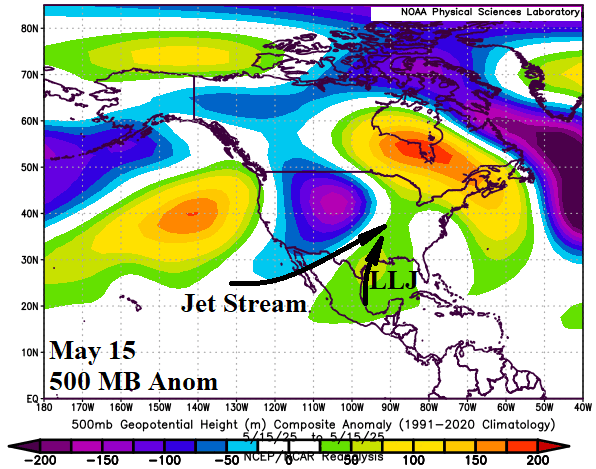
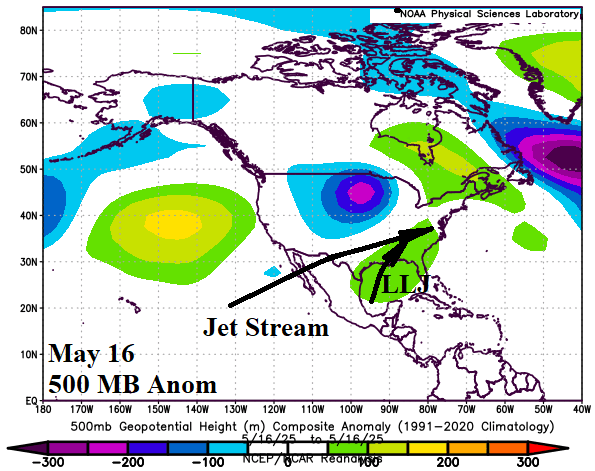
Fig. 1-4: Severe weather reports for the May 15-16 outbreaks and the 500 MB anomaly analysis for each day.
Discussion: As a review, an exceptionally intense severe weather episode was observed late last week across the Upper Midwest, Midwest, and Mid-Atlantic States. On May 15 (Thursday), NOAA/SPC’s final count of severe weather reports is 657 including an unusually high amount of hail (274) plus 32 tornado reports (Fig. 1). On May 16 (Friday), NOAA/SPC counted 1, 216 damage reports including a whopping 371 hail damage events and 815 wind damage reports (Fig. 2). The 2-day period featured nearly 2,000 damage reports (1,873) with many directly affecting major cities including Chicago and the Washington/Baltimore area. The prevailing upper air pattern for the back-to-back days of exceptionally damaging severe weather outbreaks included a deep (and cold) upper trough shifting from the central Rockies on May 15 to the Upper Midwest on May 16 (Fig. 3-4). The jet stream axis running over the low-level jet (LLJ) generates severe storms. The jet stream intersection with LLJ curled northward into the Upper Midwest on May 15 and extended into the Tennessee Valley to fuel the May 16 outbreak. Typical of any major severe weather event, the Madden Julian oscillation (MJO) was involved. The convection phase of the MJO stretched across the tropical East Pacific and the dip in the jet stream south of the 500 MB low entrained tropical moisture northeastward into the U.S. precipitation pattern.