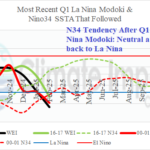
La Nina Modoki Analogs
03/03/2025, 12:59 pm EST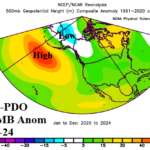
New Vs. Old Pacific Decadal Oscillation
03/14/2025, 3:40 pm EDT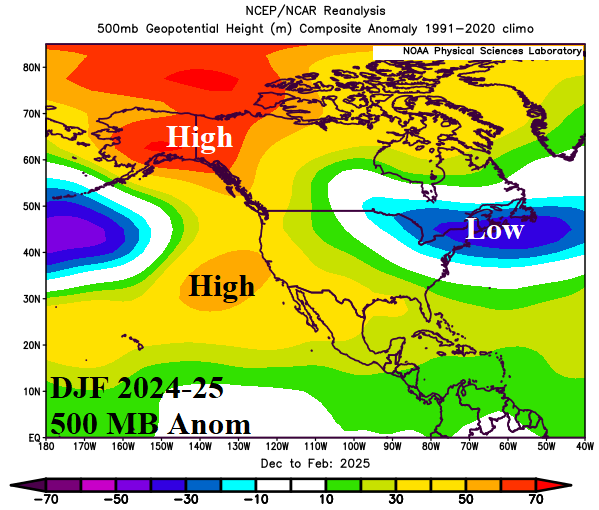
Discussion: A mild upper ridge pattern covered most of North America to start meteorological winter (Fig. 1). During mid-winter, an intense low-pressure area developing during late December east of New England expanded westward in January as a polar vortex episode was observed just after mid-month (Fig. 2). The upper ridge shifted westward to the Northeast Pacific and briefly “bridged” over Alaska to Siberia during the cold event just after mid-January. In February, the polar vortex remained over Southern Canada detached from the ongoing deep low pressure east of New England while a broad subtropical high pressure area set-up across the Southern U.S. (Fig. 3). The 3-month average yielded a deep low on the New England Coast, amplified high over Alaska and off the California Coast (Fig. 4). The DEC/JAN/FEB 2024-25 upper air pattern was completely different from the 5-year, 10-year, and 30-year normal. Typically, the recent years during wintertime produce an upper ridge over a persistent marine heat wave (MHW) in the Northeast Pacific and near New England due to the warmer than normal North Atlantic. In-between the amplified high-pressure areas, susceptibility to a polar vortex pattern forms over northwest to central Canada (Fig. 5-6). The long-term 30-year climatology shifts the Canadian low-pressure area to Southwest Canada otherwise is quite similar with the short-term regime (Fig. 7). The winter 2024-25 upper air pattern is unique with the low-pressure area off the New England Coast and ridge over northwestern North America directly opposite of normal expectation. Due to a weak ENSO regime forecast for winter 2024-25, versions of climatology were applied to most climate forecasts. The application of long-term normal or short-term optimum climate normal (OCN) caused an error in the winter outlook, which was biased warm in the East, cold in the Northwest, and wet in the Northwest and much of the East (Fig. 8-9). Verification reveals the East was unexpectedly chilly and the national pattern drier than forecast (Fig. 10-11).
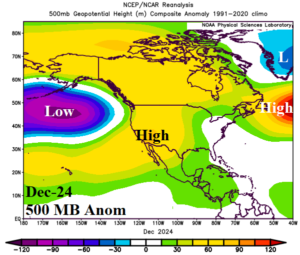
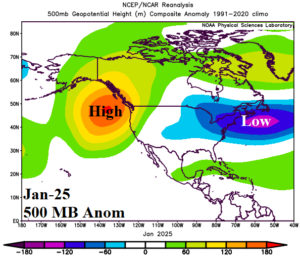
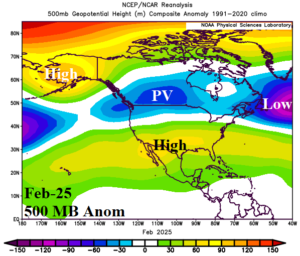
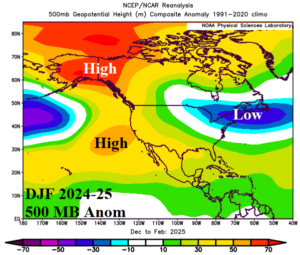
Fig. 1-4: The 500 MB anomaly “upper air” pattern for each month of meteorological winter 2024-25.

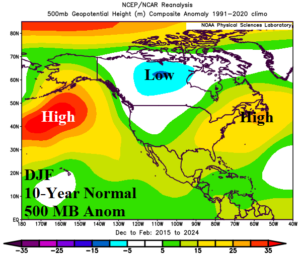
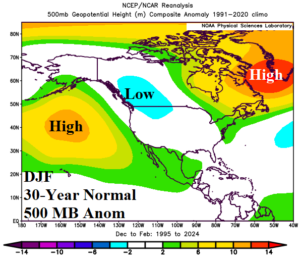
Fig. 5-7: The DEC/JAN/FEB 500 MB anomaly “upper air” pattern for the past 5 years, 10 years, and 30 years is much different from just-finishes winter 2024-25.
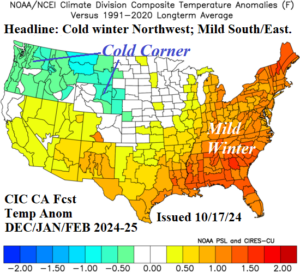

Fig. 8-9: The Climate Impact Company constructed analog temperature and precipitation anomaly forecast for meteorological winter 2024-25 issued last October.
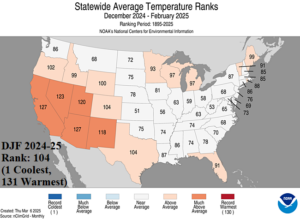
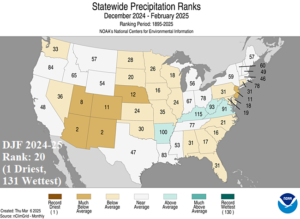
Fig. 10-11: Observed U.S. state temperature and precipitation rankings for meteorological winter 2024-25.