Steady +SOI Supports Trend Toward La Nina
09/02/2024, 10:35 am EDTUpper Ridge Pattern Continues Over Northwest Eurasia and Well-Correlated to Norwegian Sea MHW
09/05/2024, 5:12 pm EDT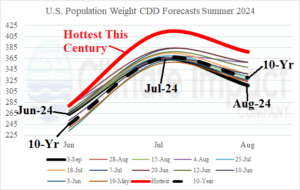
Fig. 1: A series of Climate Impact Company monthly U.S. population weight CDD forecasts compared with observed results, the 10-year normal, and hottest since 2000 values.
Discussion: Climate Impact Company U.S. population weight CDD forecasts for meteorological summer 2024 issued during late May/early June were closest to the observed values. As time went on, subsequent forecasts were much warmer (Fig. 1) propelled by fear of drought-induced heat in the Central U.S. and anomalous warmth in high energy demand areas of the East U.S. fueled by very warm SSTA off the Atlantic Coast. Unexpected was a semi-permanent trough in the Central U.S. during mid-summer easing heat risk in that region while the SSTA off the East Coast cooled dramatically mid-to-late summer affecting upper air patterns that prevented any consistent important heat from striking the East. The weather patterns described were also causal to over-forecasting anomalous warmth in much of the U.S. during medium range forecasts by all operational models. The verified monthly U.S. population weight CDD was warmer than the 10-year normal for JUN, near the 10-year normal in JUL, and cooler than the 10-year normal in AUG. NOAA summer 2024 temperature anomaly rankings are likely historic due to comparison with the 30-year normal.