The Likelihood of Abundant Northern Hemisphere Early Season Snow Cover
09/21/2024, 9:03 am EDTNAWH Pattern Dominates Europe Summer Climate
10/01/2024, 8:11 am EDT| As of 9/26/24 | Tropical Storms | Hurricanes | Major Hurricanes | ACE Index |
| 2024 | 9 | 5 | 2 | 68.3 |
| 30-Year NML | 10.5 | 4.9 | 2.2 | 88.8 |
Table 1: As of Sep. 26, the 2024 North Atlantic basin seasonal tropical cyclone activity compared to the 30-year normal.
| OCTOBER | Tropical Storms | Hurricanes | Major Hurricanes |
| 1995-2023 | 2.6 | 1.3 | 0.6 |
| Most (2005) | 7 | 3 | 2 |
| Least (2002, 2006) | 0 | 0 | 0 |
Table 2: During the 1995-2023 long-term climate cycle as defined by phase changes in ENSO, PDO, and AMO the average amount of tropical cyclone activity for October is indicated.
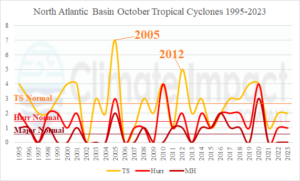
Fig. 1: During the 1995-2023 long-term climate cycle as defined by phase changes in ENSO, PDO, and AMO the average amount of tropical cyclone activity for October is indicated.
Discussion: As of yesterday (Sep. 26), the North Atlantic basin 2024 tropical cyclone activity has featured 9 tropical storms, 5 hurricanes, and 2 intense hurricanes which are close to or slightly under the 30-year normal. The ACE index (68) is 77% of the 30-year normal. Isaac is forecast to become the 6th hurricane of the season later today. As September closes and the less active part of the tropical cyclone season arrives, the climatology of 1995-2023 October tropical cyclones in the North Atlantic is reviewed. Since the middle 1990’s, long-term climate cycle of El Nino southern oscillation (ENSO) and Pacific decadal oscillation (PDO) flipped to the negative (cool) phase while the Atlantic multi-decadal oscillation (AMO) shifted to the positive (warm) phase. The ENSO/PDO/AMO long-term cycle change is favorable to North Atlantic basin tropical cyclone activity helping to explain why the modern-day 30-year normal is higher than longer term climatology. On average, during the 29-year period identified, October produces 2.6 tropical storms, 1.3 hurricanes, and 0.6 major hurricanes. The most observed was in 2005 when 7 tropical storms formed whereas 2002 and 2006 produced no tropical cyclones. The table and graph provided identify tropical cyclones with their core activity and peak intensity occurring in October.
Week-2 Valid October 6-12, 2024: Another Gulf of Mexico hurricane is expected.
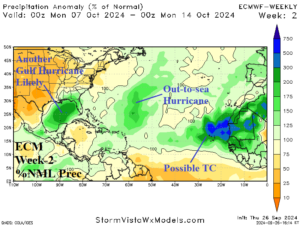
Discussion: Another hurricane is expected in the Gulf of Mexico likely making landfall in the northeast basin. Another hurricane may emerge in the central North Atlantic. Strong tropical waves are moving off the West Africa Coast.
Week 3 Valid October 13-19, 2024: Tropical cyclone generation in the vicinity of the Northern Caribbean Islands.
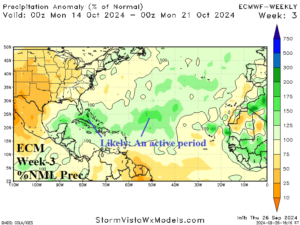
Discussion: The outlook maintains above normal risk of tropical cyclone development across the Northern Caribbean/Bahamas and central North Atlantic tropics.
Week 4 Valid October 20-26, 2024: U.S. coastal risk diminishes.
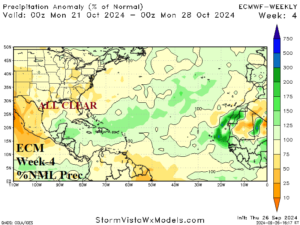
Discussion: Support for tropical cyclone generation eases. ALL CLEAR is issued for the Gulf of Mexico States.
Week 5 Valid October 27-November 2, 2024: Lingering TC risk central tropics.
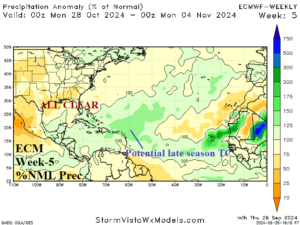
Discussion: The central North Atlantic basin is potentially active. However, the U.S. Coast is ALL CLEAR.