Finally, the global climate enters El Nino. What’s ahead in 2024?
12/14/2023, 2:04 pm EST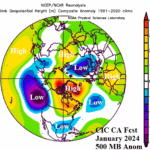
Upper Air Forecast for January 2024 in the Northern Hemisphere
12/22/2023, 1:16 pm EST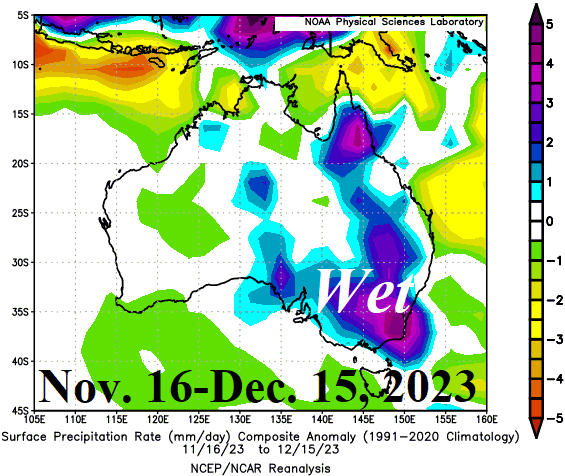
Highlight: Why is Eastern Australia wet during the 2023 El Nino?
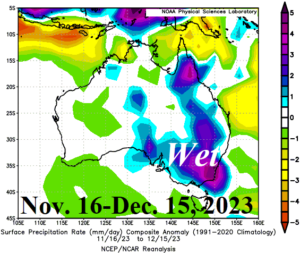
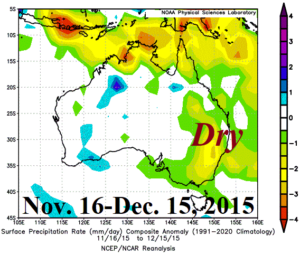
Fig. 1-4: The rainfall rate anomalies for the 30-day period ending December 15th for 2023, 2015, 2009, and 2002.
Australia discussion: Early meteorological summer is usually drier than normal across Eastern Australia when El Nino is present. However, the past 30 days have featured robust wet anomalies across the eastern third of the continent (Fig. 1) in contrast with very dry weather of the last 3 El Nino years for the same period in 2015, 2009, and 2002 (Fig. 2-4). Rainfall forecasts through the remainder of December maintain the very wet East Australia pattern (Fig. 5–6). Why is the unexpected rainfall occurring?
One possible explanation, becoming increasingly common in the modern climate era, is the influence of warming subtropical and mid-latitude oceans on the prevailing upper air pattern that causes our weather. The warming zones sometimes are referred to as marine heat waves (MHW). There is a tendency for increased subtropical high pressure-ridging across or downwind MHW regions. Currently, MHW’s west and southwest of Australia and in the vicinity of New Zealand (Fig. 7) are well-correlated with amplified subtropical high-pressure ridge areas mostly south of Australia’s latitude (Fig. 8). Consequently, to compensate for the high pressure, a low-pressure area has formed over Australia spawning the wet pattern across eastern continent. Note that during strong El Nino episodes (1982, 1997, and 2015) Australia is typically covered by strong high-pressure ridging with elongated low-pressure troughs south of Australia (Fig. 9).
A complete change in the standard ENSO climate, likely related to the warming oceans poleward of the tropics.
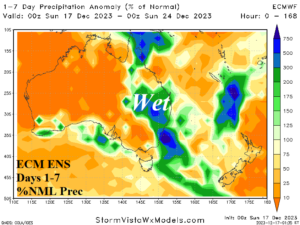
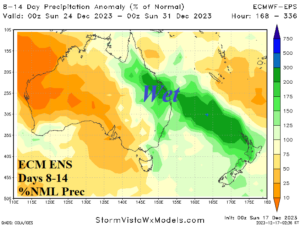
Fig. 5-6: The ECM ENS percent of normal rainfall forecast for the next 2 weeks across Australia.
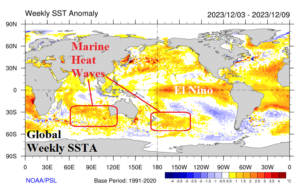
Fig. 7: Global weekly SSTA analysis identifying marine heatwaves in the southern hemisphere affecting Australia climate.
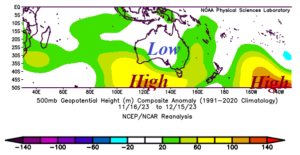
Fig. 8: Upper air pattern in the vicinity of Australia for the past 30 days.
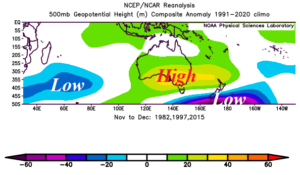
Fig. 9: Upper air pattern for the 1982, 1997, and 2015 El Nino years during Nov. 16-Dec. 15 which show a complete reversal from the 2023 El Nino regime.