The MANY Adverse Effects on Climate by the Current Historic Positive Phase of the Indian Ocean Dipole
10/23/2019, 4:10 am EDTThe Most Reliable U.S. Spring 2020 Flood and Drought Outlook
02/27/2020, 4:50 am EST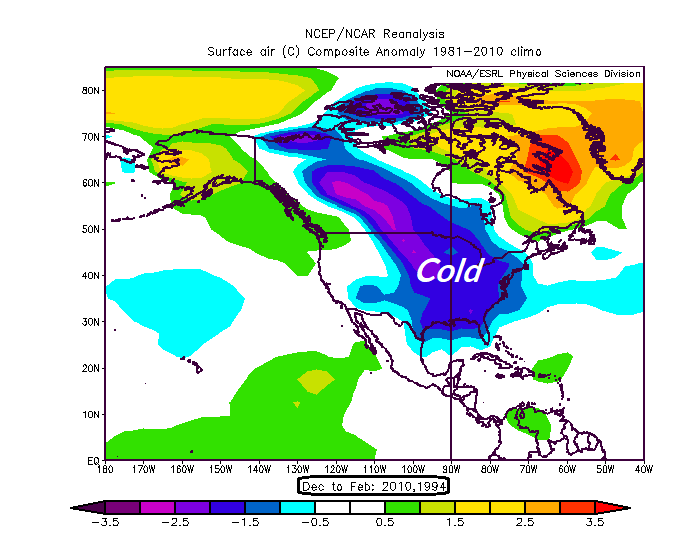
Using dramatic (1993) and the most recent (2009) similarly wet Great Plains Palmer Drought Severity Index as a following winter temperature and springtime precipitation predictor
Discussion: Extreme soil moisture regimes are the result of long-term climate patterns which not only explain why large regions of wet soils or drought occurred but can also project future climate patterns. The Great Plains soil moisture regime is historic wet right now (Fig. 1) caused by the wettest 12-month period on record for this region (Fig. 2). A look back at the closest analog years reveals the most recent similarity is 2009 (Fig. 3) and most dramatic 1993 (Fig. 4). The 12-month upper air patterns identifying the climate regimes producing the excessive rainfall are similar with each showing a persistent upper trough in the Central U.S. (Fig. 5-7). The global SSTA was much cooler in 1993 (Fig. 8) versus 2019 (Fig. 9) which helps to explain the dominant cool trough of 1993 versus the weaker trough of 2009 and 2019 (but surrounded by strong upper ridge patterns). What was the prevailing upper air pattern the following winter for the analog years (Fig. 10) and the attendant temperature anomalies (Fig. 11) plus the following spring precipitation pattern (Fig. 12)? The winter upper air pattern varied between a strong central North America cold upper-level trough (1993-94) or elongated middle latitude cold trough to the south of a high latitude high pressure blocking pattern (2009-10). However, the consensus upper pattern certainly supports the prevailing cold U.S. pattern observed for both of the analog winter season. The persistent more-than-one year in time scale upper trough finally fades for following spring with the analog years yielding dryness for Midwest States. Despite the frigid analogs the prevailing winter climate forecasts are mild as shown by NOAA/CPC (Fig. 13-14).
Fig. 1: The wettest soil moisture observations on record are present now in the North-central U.S. and parts of the Mid-South.
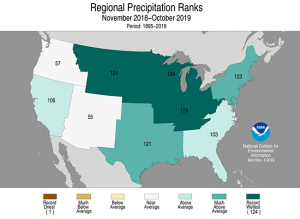
Fig. 2: The wettest 12-month period on record across the North-central U.S.
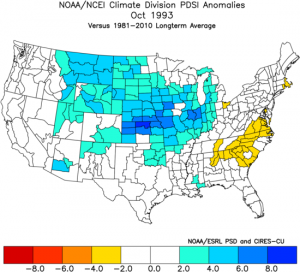
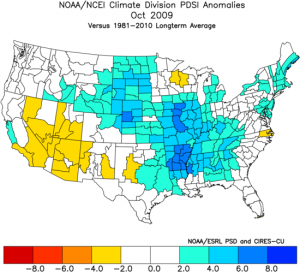
Fig. 3-4: The October 2009 and 1993 Palmer Drought Severity Index identifying extreme wet soils similar to 2019.
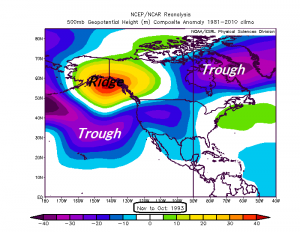
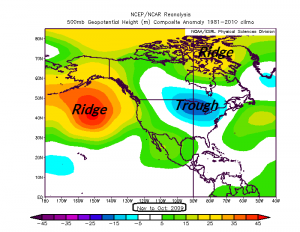
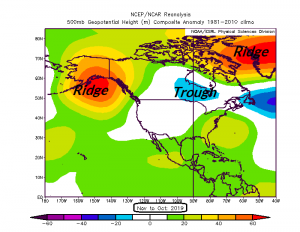
Fig. 5-7: The 12-month upper air patterns leading to excessive rainfall causing very wet soil moisture conditions in the Great Plains observed in October of 1993, 2009 and 2019. Notice how the cold trough was responsible for the wet weather in 1993 whereas the relatively weaker trough of 2009 and 2019 was made more effective by the surrounding warm upper ridge patterns.
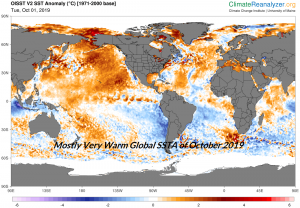
Fig. 8: The warm ocean anomalies of October 2019.
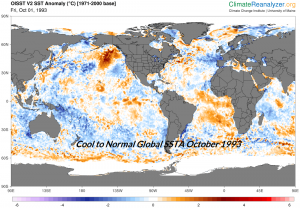
Fig. 9: The mostly cool ocean anomalies of October 1993.
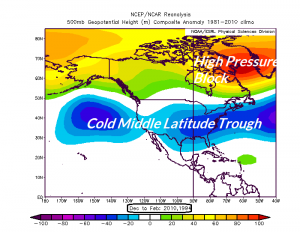

Fig. 10-11: Upper air pattern and temperature anomalies for DEC/JAN/FEB combining winter of 1993-94 and 2009-10.
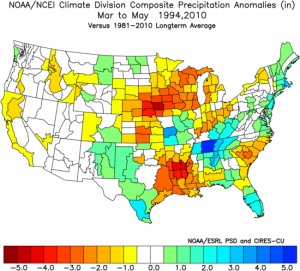
Fig. 12: Using the winter of 1993-94/2009-10 analogs to project precipitation anomalies for following springtime.
Conclusion: The prevailing MODEL forecasts for U.S. winter 2019-20 favor warm risk with the North-central U.S. at equal risk of above, below or normal temperature according to NOAA/CPC (Fig. 13). Interestingly, the NOAA/CPC precipitation risk outlook is wet across the northern U.S. (Fig. 14) and this precipitation type is likely mostly snow. If the snowy forecast is correct the 1993-94/2009-10 cold analogs have a chance as U.S. modern-day temperature regimes respond in a cold manor to snow cover during the winter season. The analogs are convincingly cold and several private forecasters are cold citing the expanding North America snow cover as a cold-supporting regime once we’re into the winter season. Why are the models so warm? The models are responding to the influence of much warmer-than-normal northern hemisphere SSTA regimes.
Fig. 13-14: NOAA/CPC temperature and precipitation probability forecasts for DEC/JAN/FEB 2019-20.
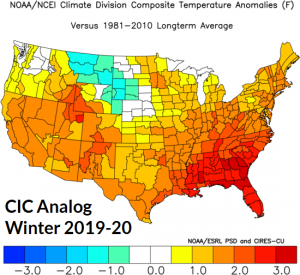
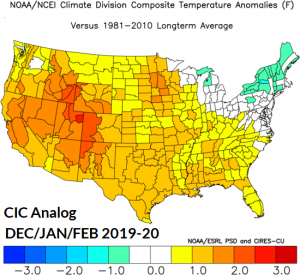
Fig. 15-16: The CIC analog temperature anomaly forecast for winter 2019-20 issued last September and updated in October.
Initially, the Climate Impact Company winter 2019-20 outlook was very warm in response to the historic warmth of the northern hemisphere oceans (Fig. 15). Increasing early season snow cover biased the outlook colder in the Northeast with the October update (Fig 16). However, the latest month 1-3 outlook indicates the warm December (Fig. 18) is still there (but not as warm as previously forecast) and northern cold is stronger and expanding for JAN/FEB 2020 (Fig. 18-19). Can the super-cold 1993-94/2009-10 analog occur? There is a small risk but the super-warm northern hemisphere ocean surface prevents that scenario and the cold that does occur will be entirely dependent on snow cover and the snowfall forecast is looking increasingly supportive of a colder winter than previously indicated.
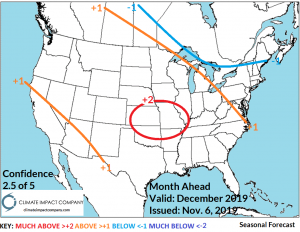
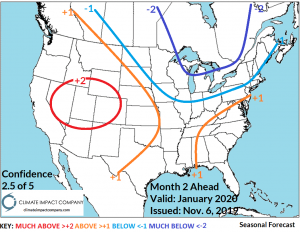
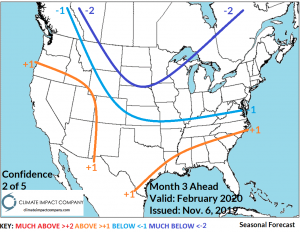
Fig. 17-19: The CIC operational temperature anomaly forecasts for DEC-10, JAN-20 and FEB-20.