Warmer and higher than normal sea surface contibutes to Mid-Atlantic flooding
10/13/2019, 9:22 am EDT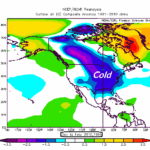
Using Wet PDSI Analogs to Predict Winter Temperature and Following Spring Precipitation
11/10/2019, 7:48 pm EST
Fig. 1: Record-strength +IOD causes a late wet Indian Monsoon, enhances dryness in Australia and forces light wind in the central/east equatorial Pacific that allows surface and subsurface warming.
Discussion: The effects on climate by a historic positive phase of the Indian Ocean have been dramatic (Fig. 1). The monsoonal low pressure trough should be shifting south toward the equator in the Indian Ocean as November 1st approaches. However a southwest flow across the much warmer than normal western Indian Ocean maintains the wet climate across India. The moist southwest flow will not relent until strong trade winds across the eastern equatorial Indian Ocean ease. The strong trade winds are up-welling cool waters in the eastern Indian Ocean tropics cutting off the moisture source for Australia rainfall. The strong trade winds and cool ocean waters north and northwest of Australia have contributed to unusually high pressure at Darwin. The southern oscillation index, a measure of ENSO phase has persisted in a negative El Nino-like character for months (Fig. 2) despite the collapse of a weak El Nino earlier this year. As a result the eastern equatorial Pacific surface and subsurface has warmed fairly dramatically in October.
The longest wet monsoon on record for India continues. Overnight operational models indicate heavy rainfall is likely over central and southern Indian the next 15 days taking the wet monsoon into November! Last week produced 4-8 inches of rain across the southwest and southeast coastal areas with 2-4 inches extending well inland (Fig. 3).
Meanwhile despite no El Nino in several months dryness across Australia has worsened. Since July record to near record rainfall shortages have been observed across southwest, south-central and southeast Australia contributing to historic water shortages (Fig. 4). Operational forecast models maintain a very dry climate well into November.
Finally, after a lengthy period of dry weather followed by a near record hot September a flash drought developed across the Southeast U.S. However, suddenly the pattern flipped wetter with widespread 2-6 inch rainfall amounts last week across the Southeast U.S. extending northward to New England (Fig. 5). Soil moisture deficits eased in this stretch. Operational models indicate more beneficial wet weather is on the way for the Gulf of Mexico region.
In summary, climate models are indicating the strong +IOD to start fading and neutral ENSO for the next 3-6 months. However, the +IOD continues to strengthen and signs of weak El Nino have emerged.

Fig. 2: Negative phase southern oscillation index was choppy during a weak El Nino earlier this year but has become more consistent in recent months as Darwin sea level pressure became elevated due to the strong positive phase Indian Ocean Dipole while Tahiti pressure was near normal. The steady –SOI has ignited warming of the eastern equatorial Pacific Ocean both on the surface and subsurface.

Fig. 3: Excessive rainfall associated with latest wet monsoon on record across India continued last week.

Fig. 4: Record to near record rainfall deficits have occurred across much of Australia the past several months despite the lack of an El Nino, the most common drought producer. A historic +IOD regime is the cause.

Fig. 5: After the driest September on record in the Southeast U.S. a sudden wet pattern has emerged in the Southeast U.S. likely related to warming of the eastern equatorial Pacific Ocean in October.