Rainfall Needed to Neutralize Dry Palmer Drought Severity Index is Increasing Across The Eastern U.S.
06/13/2023, 8:51 am EDTERCOT JUN/JUL 2023 CDD Forecast Trending Much Hotter
06/15/2023, 5:47 am EDT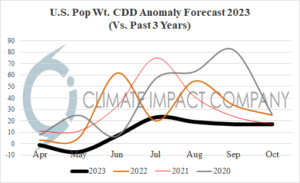
Fig. 1: The Climate Impact Company CDD anomaly forecast for each month of the 2023 warm season compared to the 30-year normal and the past 3 years.
Discussion: The 2023 warm season began with below normal cooling demand (90 CDD) compared to normal (97 CDD) using NOAA verification (Fig. 1). The coolest zones were the high demand Northeast U.S. Corridor and California. The projection for June is very close to normal (220 CDD forecast vs. 2013 CDD normal). The slightly above normal value is driven by the Texas Market (488 CDD forecast vs. 431 CDD normal). In June, the Northeast U.S. and California markets maintain below normal cooling demand in June. The mid-summer CDD forecast eases back from 354 CDD to 344 CDD based on the most recent Climate Impact Company month 1-3 outlook. Normal CDD is 321 CDD for July. There are significant cooler adjustments including the Northeast Market. Despite the near-term heat across ERCOT, the July CDD is 573 (545 is normal) but eases back from the previous forecast of 587. The West U.S. Markets are also cut back and while remaining hotter than normal are no longer forecast to reach a hot extreme as previously expected. The August forecast maintains a similar theme…a previously hot forecast (316 CDD) eases back (309 CDD) closer to normal (290 CDD). The cooler revision is across the Northeast Corridor and the West U.S. Markets. Much warmer adjustments are made in the Central/East-central U.S. although ERCOT is cut back from 560 CDD to 540 CDD (529 CDD is normal). Finally, September warmth is centered on the lower electricity demand North-central/Upper Midwest U.S. while the West Coast is near normal, and the East is not as warm as previously forecast. The 2023 warm season U.S. population weight CDD forecast starts with near 30-year normal values (MAY/JUN) warming to almost exactly in-between the 10-year/30-year normal (Fig. 2).
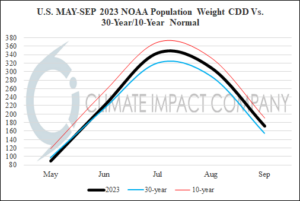
Fig. 2: The Climate Impact Company population weight CDD forecast for each month of the 2023 warm season compared with the 10-year/30-year normal.
The 5 locations in the U.S. with highest cooling demand (compared to normal) for JUN/JUL/AUG 2023 is Des Moines, Chicago, and Minneapolis plus Portland/Seattle. The 2 locations in the U.S. with lowest cooling demand are Boston and New York City.