Quarter 1 of 2024 was 5th Warmest on Record in U.S.
04/11/2024, 4:14 pm EDTClimate Impact Company Issues U.S. Summer 2024 Outlook
04/15/2024, 2:48 pm EDT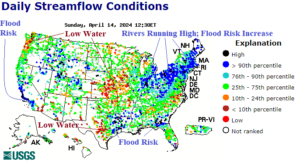
Fig. 1: Latest U.S. daily streamflow analysis.
Discussion: Due to excessive rainfall in the Ohio Valley and Mid-south U.S. and amplified by snowmelt in New England, streamflow conditions are running at or above capacity (Fig. 1) making flooding susceptibility continuously high if additional significant precipitation occurs. Other regions with similar difficulties are southwestern Georgia and much of the California Coast. Conversely, rivers are running low due to lack of precipitation across Kansas to Illinois, Southcentral Texas, and western Washington.
Today’s 15-day precipitation forecast is produced using the new AIFS (artificial intelligence forecast system) generated by ECMWF. In the outlook through Thursday, there is heavy rain risk (1-2 in.) centered on the Iowa drought region with widespread >1 in. amount forecast for the Ohio Valley (Fig. 2). In the 6-10-day period, the model indicates a possible excessive rainfall event near Houston (Fig. 3). In the 6-10-day period, more rain and snowmelt will aggravate high-running rivers in that region. In the 11-15-day period, AIFS projects significant rainfall events in the Mid-south to northern Gulf States (Fig. 4). The “most likely” U.S. medium-range temperature anomaly forecast using mega-cluster ensemble reveals some cooler than normal weather moving across the Midwest U.S. in the 6-10-day period (Fig. 5) followed by rewarming of the Central U.S. in the 11-15-day forecast (Fig. 6). Late season heating demand in the U.S. is closer to normal for mid-to-late April although warmer than yesterday (Fig. 7). The CDD forecast remains low, in the 15-21 range for late April.
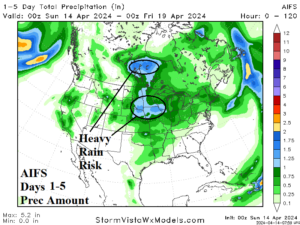
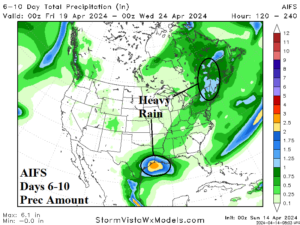
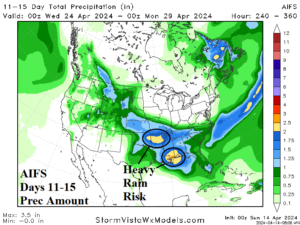
Fig. 2-4: The U.S. AIFS (from ECMWF) 15-day precipitation amount forecast.
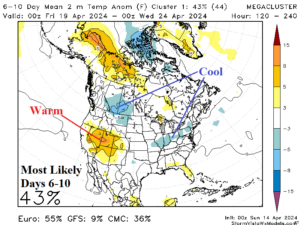
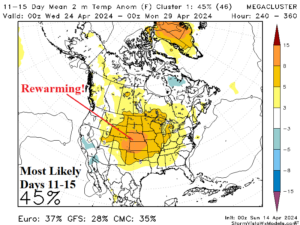
Fig. 5-6: “Most likely” medium-range temperature anomaly forecast for U.S.
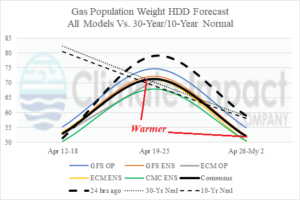
Fig. 7: The U.S. gas population weight HDD forecast using all models and their consensus and compared with 24 hours ago plus the 30-year/10-year normal.