Will Evolution of +IOD Interrupt La Nina 2024 Expectations?
04/11/2024, 9:16 am EDTIntroducing Artificial Intelligence Forecast System (AIFS) from ECMWF…The First AI-Generated Precipitation Forecast
04/14/2024, 1:58 pm EDTVerification of March 2024 (17th warmest) and Q1/2024 (5th warmest).
Discussion: March 2024 was the 17th warmest on record lead by a MUCH ABOVE normal character of the entire northeast quadrant of the U.S. (Fig. 1). Connecticut and Delaware came closest to a record each finishing the month 8th warmest of the past 130 years. Only a handful of western states were near normal with each (other) state warmer than normal.
The March 2024 precipitation verification was 31st wettest on record. The Northeast Corridor was wettest with MUCH ABOVE normal precipitation for New Jersey to all New England (Fig. 2). Maine and Rhode Island observed their 2nd wettest March on record followed closely by Vermont, New Hampshire, New Jersey, and Delaware each recording their 3rd wettest March. Very limited drier than normal state rankings were observed in March.
Q1 of 2024 was warmer than normal in each of the 48 contiguous states including MUCH ABOVE normal for the Upper Midwest to Mid-Atlantic to New England States (Fig. 3). Six states finished the 3-month period with their 2nd warmest Q1 on record, including Maine, New Hampshire, Vermont, New York, Michigan, and Wisconsin. Nationally, Q1 was 5th warmest on record.
JAN/FEB/MAR 2024 was 10th wettest on record. Many states were wetter than normal. The entire Northeast Corridor from Virginia to Maine observed MUCH ABOVE normal precipitation for the first 3 months of the year (Fig. 4). Rhode Island was 2nd wettest on record while Connecticut ranked 4th wettest. The Upper Midwest was drier than normal.
Overall, the Q1/2024 U.S. climate pattern was shaped by a vigorous upper trough in the West U.S. and a compensating upper ridge pattern over northeastern North America (Fig. 5). The relatively low latitude trough tapped abundant low level atmospheric warmth and water vapor enabled by warm El Nino waters to cause the nationally warm and wet climate pattern. The Q1/2024 observations were warmer than forecast due to the unexpected intensity and low latitude position of the upper trough in the West U.S.
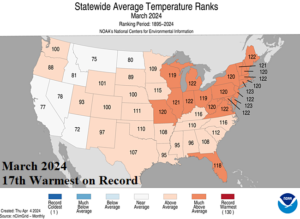
Fig. 1: The NOAA state temperature rankings given the 130-year (1895-2024) climatology for March 2024.
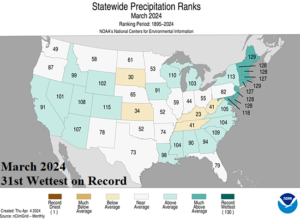
Fig. 2: The NOAA state precipitation rankings given the 130-year (1895-2024) climatology for March 2024.
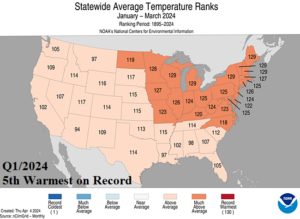
Fig. 3: The NOAA state temperature rankings given the 130-year (1895-2024) climatology for January through March 2024.
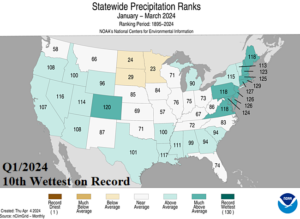
Fig. 4: The NOAA state precipitation rankings given the 130-year (1895-2024) climatology for January through March 2024.
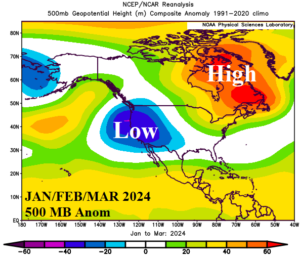
Fig. 5: The upper air pattern for Q1/2024 across North America.