Frigid Arctic Air Mass Should Break in About 12 Days
01/09/2024, 4:31 pm ESTMarine Heat Waves and Attendant Upper Air Pattern Influence on Australia Climate
01/28/2024, 1:08 pm EST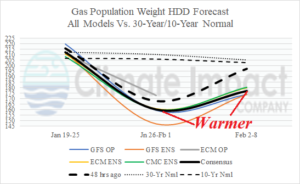
Fig. 1: U.S. gas population weight HDD forecast using all models, their consensus, and comparison with 48 hours ago and the 30-year/10-year normal.
Discussion: Since Friday, the U.S. gas population weight HDD forecast trends warmer (less demand) through the first week of February. HDD forecasts are in the 155-160 range for next week and near 175 for Feb. 2-8 (Fig. 1). All models are in general agreement except GFS ENS which is super warm for next week.
What is an atmospheric river? A large and narrow stream of high intensity moisture extending from tropical influences pushed by the jet stream across mid-latitude land masses. The North Pacific atmospheric river is the most famous (and effective).
What causes an atmospheric river to form? The best way to create an atmospheric river is the phasing (or connection) between the storm track propelled by the subtropical jet stream and increased heavy convection in the deep tropics enhanced by presence of large areas of strong vertical currents known as the positive (or convection) phase of the Madden Julian oscillation (MJO).
Forecast models indicate a strengthening convection phase of the MJO into phase_6 (tropical West Pacific) over the next 1-2 weeks (Fig. 2). The subtropical jet stream entrains some of the buoyant tropical moisture, mainly in the medium-range forecast, transporting excessive precipitation into Western Canada and the Pacific Northwest U.S. in the 6-10-day period (Fig. 3) and the southwest quadrant of the U.S. especially California in the 11-15-day period (Fig. 4).
The precipitation forecasts are based on the mega-cluster ensemble which favors the ECMWF solution but also includes GFS and ECM with the “most likely” forecast. Interestingly, the forecast confidence is a low 35% for the 6-10-day period but increases to a lofty 71% in the 11-15-day period.
Of course, the MJO influence strengthens the Pacific storm track, and the release of latent heat by storms crashing into the West Coast of North America is released downstream to cause a very warm 15-day forecast (Fig. 5) across North America extending into early February.
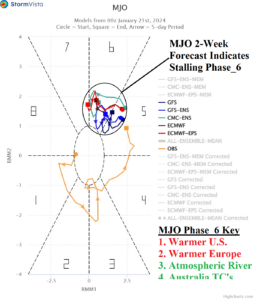
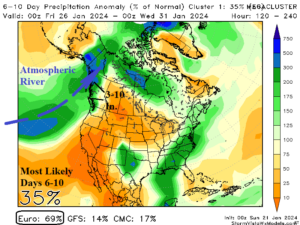
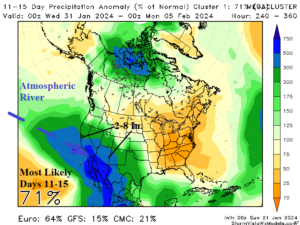
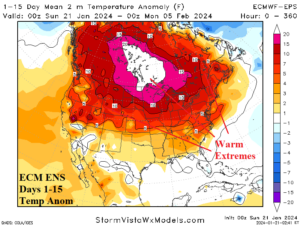
Fig. 2-5: The 2-week MJO forecast, 6-10-day and 11-15-day mega-cluster ensemble percent of normal precipitation forecast across North America, and the attendant 15-day (ECM ENS) temperature anomaly forecast for the U.S.