El Nino Steadily Strengthening
08/21/2023, 1:39 pm EDTDoes it Seem Like U.S. Summer is Lasting Longer?
08/25/2023, 9:47 am EDTHighlight: Population weight DD forecast update, warmer Northeast days 11-15.
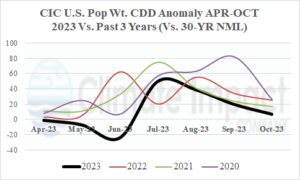
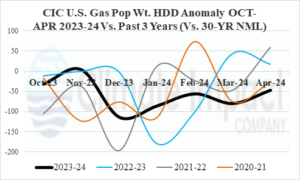
Fig. 1-2: Climate Impact Company monthly APR-OCT 2023 U.S. population weight CDD observations and forecast plus the U.S. gas population weight OCT-APR 2023-2024 HDD anomaly observations and forecasts.
CDD/HDD discussion: The latest U.S. population weight CDD forecast was adjusted slightly warmer (321 to 329) for August (Fig. 1) which is a moderately hotter than normal signature (compared to the 30-year normal). August 2023 will average slightly less hot than the past 3 years. The September outlook has minor adjustments averaging slightly warmer than the 30-year normal and (also) not as warm as the past 3 years.
The winter 2023-24 outlook is most notably warm on the front end of meteorological winter with (very) warm values in December (Fig. 2). On average, El Nino produces below normal national heating demand for mid-to-late winter as shown. Recent years have produced cold spikes in January (2022), February (2021), and March (2022). A surprise sneak cold month in JAN or FEB is possible and likely related to stratospheric warming.
12Z GFS discussion: The U.S. population weight CDD forecast at midday is not much different from overnight or 24 hours ago (Table 1). The early September CDD forecast is very warm. In the tropics, as previously stated, El Nino westerly shear has arrived and is inhibiting tropical cyclone development. The 6-10-day forecast trend was cooler in the Missouri/Ohio Valley(s) although West U.S. heat sneaks into the central Great Plains (Fig. 3). In the 11-15-day period the Northeast is surprisingly much warmer while the Northern Rockies and Canadian prairies are much cooler (Fig. 4).
| Dates | CDD Forecast | 12-Hr Change | 24-Hr Change | 30-Year NML | 10-Year NML |
| Aug. 18-24
| 84.5 | -0.1 | -0.6 | 71.3 | 76.5 |
| Aug. 25-31
| 80.7 | -2.1 | -2.7 | 66.2 | 72.6 |
| Sep. 1-7
| 81.2 | +4.4 | -5.0 | 59.2 | 66.4 |
Table 1: The 12Z GFS U.S. population weight CDD forecast compared to 12 and 24 hours ago.
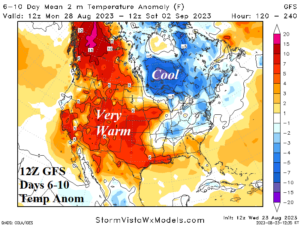
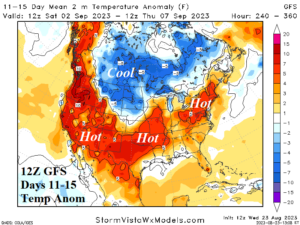
Fig. 3-4: The 12Z GFS temperature anomaly forecast for the medium-range.