Summer 2023 CDD’s For The U.S.
08/23/2023, 3:47 pm EDTEl Nino Strengthening But Subsurface A Lot Different From 2015 El Nino Episode
08/28/2023, 11:50 am EDT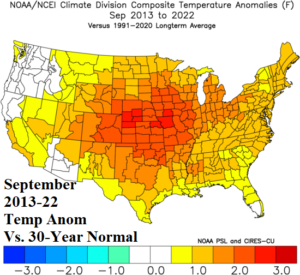
Fig. 1: September temperature anomalies from the past 10 years compared to the 30-year normal.
Discussion: A standard climatology is based on 30 years of history averaged together to produce a value that represents the expected temperature or precipitation for a given month. When recent climate is consistently different from the 30-year climatology, an optimum climate normal (OCN) develops. Typically, an OCN is a 10-year or 15-year temperature and/or precipitation pattern showing somewhat different character from the 30-year normal. Given the warmer oceans and constricting ice cap of recent decades, there is a tendency for warmer climate vs. the 30-year normal and September in the U.S. is an example (Fig. 1). During the past 10 years, September has averaged 1-3F warmer than the 30-year normal, making summer feel longer. Climate Impact Company applies OCN to all climate forecasts.
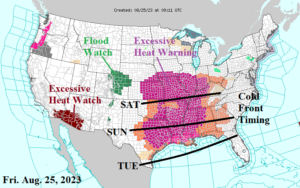
Fig. 2: The latest NOAA/NWS weather watch, warning, and advisory areas.
Fortunately, the latest heatwave ends before the end of August (although more heat is on the way in September). Excessive Heat Warnings are cancelled for the northern Ohio Valley due to a cold frontal passage (Fig. 2). The cold front settles through the Missouri Calley by tomorrow. The cold front arrives in northern Texas and into the Southeast U.S. by Sunday morning and to the Gulf Coast Monday night.
Trouble is brewing in the Southeast Gulf of Mexico later this weekend and early next week brings a new tropical cyclone likely to unload heavy rainfall on the Florida West Coast and across northern Florida to the coastal Carolinas (Fig. 3).
The latest U.S. population weight CDD forecast valid through mid-September indicates a warmer solution and maintains above normal electricity demand (Fig. 4).
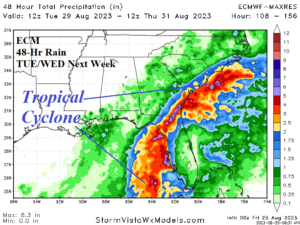
Fig. 3: ECM 48-hour rainfall valid for TUE/WED of next week.
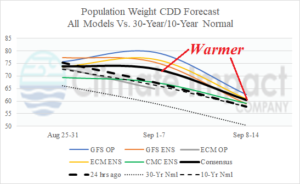
Fig. 4: U.S. population weight CDD through early September utilizing all models, their consensus and comparison with 24 hours ago plus the 10-year/30-year normal.