Transient MJO Causal to Wetter Brazil/Australia/U.S. Midwest Pattern Ahead
03/17/2024, 7:11 am EDTAustralia Climate Likely to Shift Back into Wetter Regime of Early Decade
03/25/2024, 6:02 am EDTDiscussion: The preliminary U.S. population weight monthly CDD anomaly forecast for April through October 2024 indicates a similar pattern to the past 3 years: Near normal early in the season, increasing anomalous heat through mid-season which can ease slightly late in the season (Fig. 1). The preliminary forecast is not as extreme (hot) as the past 3 years. However, the verified hotter CDD anomalies were generated by emerging summertime drought and that risk, while not well understood now could easily regenerate during JUN/JUL/AUG making the monthly CDD anomaly forecasts for 2025 increasingly aggressive.
The preliminary 2024 U.S. CDD forecast for the MAY-SEP warm season (Fig. 2) is very close to the 10-year normal (after May). The 10-year normal is considerably warmer than the 10-year normal. Common preliminary trading positions is the 10-year normal for the summer (and winter) seasons and the 2024 warm season is no exception.
Once again, the influence of drought on a general hotter than normal U.S. summer season fuels hotter extremes evident during each of the past 3 years and over-achieving vs. the 10-year normal (Fig. 3). The preliminary 2024 forecast could easily be adjusted hotter once a better understanding of the drought scenario is attained. The catalyst to the nationally hotter than normal summer seasons during recent years are the warmer than normal oceans either side of the U.S. which is well-correlated to increased subtropical high-pressure ridging.
Popular regional forecasts including ERCOT and PJM-East (Fig. 4-5) are similar with national theme with strengthening CDD totals (compared to normal) as the summer season progresses.
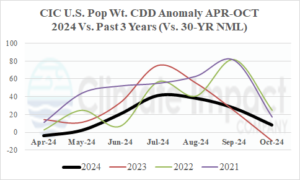
Fig. 1: The Climate Impact Company population weight CDD anomaly forecast for April through October 2024 compared the past 3 years.
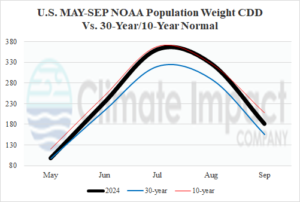
Fig. 2: The Climate Impact Company U.S. population weight CDD forecast for each month of the warm season compared to the 30-year/10-year normal.
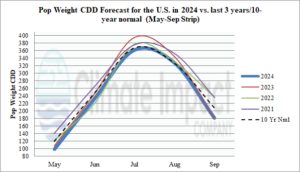
Fig. 3: The Climate Impact Company U.S. population weight CDD forecast for MAY-SEP 2024 compared to the past 3 years and the 10-year normal.
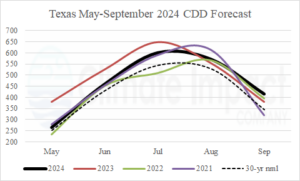
Fig. 4: The Climate Impact Company monthly population weight CDD forecast for MAY-SEP 2024 for Texas compared to the last 3 years and 30-year climatology.
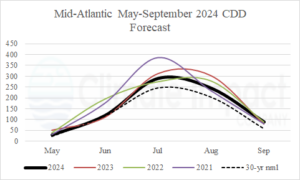
Fig. 5: The Climate Impact Company monthly population weight CDD forecast for MAY-SEP 2024 for the Mid-Atlantic compared to the last 3 years and 30-year climatology.