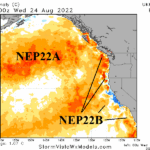
If NEP22A/NEP22B Merge…Cold East U.S. November Likely
08/25/2022, 8:03 pm EDTEarly Polar Ice Expansion Shapes Eurasia Climate
10/05/2022, 4:53 am EDTHighlight: TUTT/Low RH through mid-season sharply reduce seasonal tropical cyclone totals for the 2022 season.
| Tropical Storms | Hurricanes | Major Hurricanes | ACE Index | |
| 9/14/22 FCST | 12 | 5 | 1 | 93 |
| After 9/14 | 7 | 3 | 1 | 63 |
| 2022 So Far | 5 | 2 | 0 | 29.6 |
| 7/24/22 FCST | 18 | 8 | 3 | 130 |
| 5/3/22 FCST | 20 | 10 | 5 | 149 |
| 4/7/22 FCST | 19 | 9 | 4 | 135 |
| 15-YR NML | 16.4 | 7.3 | 3.2 | 110.6 |
| 30-YR NML | 14.8 | 7.3 | 3.2 | 120.5 |
| 50-YR NML | 12.6 | 6.4 | 2.6 | 99.2 |
| Last Year | 21 | 7 | 4 | 146 |
| 2020 | 30 | 13 | 6 | 180 |
Table 1: The Climate Impact Company 2022 North Atlantic basin seasonal tropical cyclone activity forecast is updated just-after mid-season.
Executive summary: Climate Impact Company has updated the remainder of the 2022 North Atlantic tropical cyclone seasonal forecast indicating an additional 7 tropical storms, 3 hurricanes and 1 intense hurricane with an accumulated cyclone energy (ACE) index of 63. The second half of the season projection added to activity so far produces a greatly reduced 2022 seasonal total of 12 tropical storms, 5 hurricanes and 1 intense hurricane and ACE index of 93. The precedent for reduced activity for the remainder of the season given presence of a tropical upper tropospheric trough (TUTT) and a reduced relative humidity (RH) pattern in the central North Atlantic tropics is strong based on 2007 and 2013 analog years. In the recent (2013-2021) climate pattern (minus El Nino years) the average amount of tropical activity after mid-September is about 8 tropical cyclones, 3-4 hurricanes and 2-3 major hurricanes. Presence of TUTT during the 2013-2021 climatology reduced activity. ECMWF week 2-5 outlooks are not aggressive with buoyant rainfall forecasts in the deep tropics implying a significant uptick in tropical cyclone activity for late season is moderate and not aggressive.
Updated climate discussion: In a stunning development, the North Atlantic tropics move past the midpoint of the season (September 10-11) with a paltry 5 tropical storms and just 2 hurricanes (both well-out-to-sea). The accumulated cyclone energy (ACE) index so far is 29.6 which is about 46% of normal for mid-September. Expectations for the 2022 season by most forecasters was for above to well above normal activity primarily due to resurgent La Nina and a warm North Atlantic. La Nina has returned, and the tropical ocean is warming! So…what happened?
There are two climate diagnostics identified to explain why the season has been very quiet so far. First, at 600 MB (about 14,000 feet) the relative humidity (RH) has been below to much below normal (Fig. 1). At this height in the atmosphere, RH is usually above normal for an environment favorable to tropical cyclone activity. The dry RH observed since August 1st indicates subsidence in the low-to-mid atmosphere as the most active part of the season arrives which inhibits convection associated with developing tropical systems.

Fig. 1: The relative humidity at 600 MB is a good gauge for potential tropical cyclone activity. However, when RH is below normal, implications are subsidence is present (yellow/orange) which prevents tropical cyclone activity.
Second, presence of the persistence of the tropical upper troposphere trough (TUTT) stretching from the Yucatan Peninsula to east of the Bahamas (Fig. 2). The TUTT is a relatively uncommon feature and represents a high-level atmospheric cool pool with a shear axis along the southern periphery which also defeats tropical cyclone generation. The TUTT pattern (and the dry RH regime) developed during late last spring. The last full-throttle TUTT regime at this time of year was observed in 2013 when the tropical cyclone season produced only 2 hurricanes following seasonal forecasts of 8 hurricanes (and 4 intense hurricanes) due to a weak La Nina.

Fig. 2: During La Nina, the upper atmosphere generally has light wind shear allowing tropical cyclone development to flourish. The one exception is when the relatively rare occurrence of a tropical upper troposphere is present which produces low latitude upper-level shear inhibiting development.

Fig. 3: Susceptibility to the TUTT pattern in the North Atlantic tropics may be related to a high-level strong polar vortex in Northeast Asia and the surrounding high-pressure ridge at a high latitude in North America which forced the low latitude trough as compensation.
The evolution of the TUTT pattern may be related to the unusually strong high-level polar vortex located near the North Pole this past winter and maintaining presence during northern hemisphere summer while drifting to Northeast Asia (Fig. 3). Surrounding the summertime polar vortex is above normal 200 MB heights featuring high-latitude high-pressure ridging in the lower atmosphere of North America. The TUTT may have formed to compensate for the high-latitude high-pressure pattern.
The regional SSTA environment is generally close to the early summer forecast with La Nina intact and a warming tropical North Atlantic (Fig. 4). However, the very warm northern latitude SSTA compared to the marginally warm SSTA in the subtropics/tropics present during JUL/AUG/early SEP may have also contributed to influencing the weak upper shear environment related to the TUTT regime. The recent warming in the tropics, especially in the Caribbean Sea is becoming impressive. The northeast Gulf of Mexico is also somewhat warmer than normal.

Fig. 4: Current North Atlantic SSTA and regional comments.
Updated seasonal activity forecast: The mid-to-late season forecast is based on an average of activity observed during La Nina years when TUTT was present. The analog(s) are taken from the 20-year climatology. Added to the analog is the optimum climate normal (OCN) minus El Nino years. The OCN is based on the 2013-2021 climatology focused on the unique contribution to North America climate by the evolution and persistence of northeast North Pacific marine heat waves and the cool pool of SSTA southeast of Greenland (caused by increasingly rapid ice sheet melt). The analog years are 2007 and 2013 both featuring limited hurricanes (1-3) for after mid-September. The OCN indicates up to 4 hurricanes could occur between now and the end of the season. The average of the two forecast factors is 3 additional hurricanes in 2022 plus 2 that have already occurred accumulating to just 5 hurricanes for the season. Only 1 major hurricane is expected due to the TUTT-related climatology. The ACE index is cut back to 93 for the 2022 season.
| Year (weight) | Tropical Storms | Hurricanes | Major Hurricanes | ACE Index |
| 2007 | 7 | 3 | 0 | 72 (season) |
| 2013 | 6 | 1 | 0 | 36 (season) |
| Analog | 6.5 | 2.0 | 0.0 | 54 (season) |
| OCN | 7.9 | 3.6 | 2.4 | 132.6 (season) |
| Analog + OCN | 7.2 | 2.8 | 1.2 | 93.3 (season) |
| 2022 So Far | 5 | 2 | 0 | 29.6 |
| New FCST | 12.2 (12) | 4.8 (5) | 1 (1) | 93 |
| 7/24/22 FCST | 17 | 8 | 3 | 130 |
| 5/3/22 FCST | 20 | 10 | 5 | 149 |
| 4/7/22 FCST | 19 | 9 | 4 | 135 |
| Last Year | 21 | 7 | 4 | 146 |
| 2016-2021 | 19.3 | 8.5 | 4.2 | 159.5 |
| 15-Year | 16.4 | 7.3 | 3.3 | 121.4 |
| 30-Year | 14.8 | 7.3 | 3.3 | 126.3 |
Table 2: The Climate Impact Company updated seasonal activity forecast for the 2022 North Atlantic basin tropical cyclone season compared to the previous outlooks and various climatology.
Other forecasts: Other forecasters lowered their very active initial seasonal predictions with mid-summer updates slightly, but all remain more active than normal (Table 3).
| Tropical Storms | Hurricanes | Intense Hurricanes | ACE Index | |
| CIC 9/14 | 12 | 5 | 1 | 93 |
| CSU 8/4 | 18 | 8 | 4 | 150 |
| TSR 8/9 | 17 | 8 | 3 | 130 |
| NOAA 5/24 | 14-20 | 6-10 | 3-5 | N/A |
| 30-Year NML | 14.8 | 7.3 | 3.3 | 126.3 |
Table 3: Lead providers of seasonal tropical cyclone activity for the North Atlantic 2022 season.
Projected development areas/tracks: Twice per week Climate Impact Company issues a week 2-5 outlook using the ECM model to project potential tropical cyclones in the North Atlantic basin. The most recent forecast extends to Oct. 16. Tropical cyclones after Oct. 16 are expected this season. The climatology for tropical cyclone risk after mid-October favors risk of development in the southern and eastern Gulf of Mexico with tracks arcing toward Florida and a second development area in the southwest Caribbean Sea with tracks arcing northeastward through or east of the Bahamas. In the week 2-5 outlook there is above normal risk of a development area with at least one system in the vicinity of Hispaniola (Fig. 5). Although the atmosphere favors development, this zone is not ideal for hurricane development due to the Hispaniola high terrain. The outer North Atlantic tropics look busy Sep. 25 to Oct. 2 although the model has difficulty bringing these systems westward toward the Caribbean Sea or U.S. East Coast (Fig. 6). The wet weather on the East Coast is driven by an upper trough and not tropical activity. The week-5/week-6 forecasts are not aggressive with tropical cyclone risk (Fig. 7-8). The only significant risk is to Florida for the week of Oct. 9-16. Please check the twice-per-week Climate Impact Company week 2-5 North Atlantic tropics outlook for updates.


Fig. 5-6: ECM week-2 and week-3 ahead percent of normal rainfall across the North Atlantic tropics/subtropics with annotated potential tropical cyclone activity.


Fig. 7-8: ECM week-4 and week-5 ahead percent of normal rainfall across the North Atlantic tropics/subtropics with annotated potential tropical cyclone activity.