Why The Tropics Should Become More Active Later July
07/12/2020, 11:26 am EDT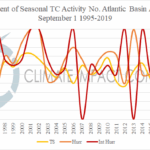
Only 2 Hurricanes So Far in North Atlantic. Can 10+ Still Occur As Seasonal Forecasts Indicate?
08/17/2020, 10:07 am EDTModern-day Moderate La Nina Climatology for SEP/OCT and NOV/DEC


Fig. 1-2: The NCEP CFS V2 (model) and Australia Bureau of Meteorology Nino34 SSTA forecasts indicate La Nina by SEP/OCT/NOV 2020.
Discussion: A modern-day ENSO episode is considered any El Nino or La Nina taking place since the middle 1990’s. In the mid-to-late 1990’s the long-term cycle of sea surface temperatures across the tropical Pacific and middle latitude Pacific/Atlantic Ocean(s) changed as defined by El Nino southern oscillation (ENSO), Pacific decadal oscillation (PDO) and Atlantic multi-decadal oscillation (AMO). As an example, notice the difference in global SSTA of the last moderate-strength La Nina events which are forecast to develop in SEP/OCT/NOV 2020 (Fig. 1-2) from the previous global SSTA cycle in 1983 (Fig. 3) compared to the modern-day global SSTA cycle in 2011 (Fig. 4). Note how much warmer the non-equatorial waters in 2011 compared to 1983. A weak La Nina is trying to organize now. However, take a look at how warm the global oceans are in July 2020 (Fig. 5).


Fig. 3-5: Comparing moderate La Nina events from the previous global SSTA cycle in October 1983 (top left) and current global SSTA cycle in October 2011 (top right) and the current global SSTA pattern for July 2020.
Moderate La Nina climate: La Nina climate is most profound during the cool season. In 2020 a moderate La Nina is forecast to begin in late quarter 3. Since the mid-to-late 1990’s three separate weak-to-moderate La Nina episodes have occurred: 2000, 2007 and 2016. A simple average climate pattern of those 3 analog years for SEP/OCT and NOV/DEC is issued for North America, Europe, South America and Australia.
September/October: The most profound temperature anomaly during SEP/OCT is the warmth across the central and eastern U.S. plus northern Europe. Strong anomalies for precipitation during moderate La Nina in SEP/OCT are dryness in the Mid-South U.S. and northern Europe while Southeast Europe is wet. During SEP/OCT Australia is typically cool across western sections and wet in the East. Brazil is typically dry and warm while wet weather is typical of moderate La Nina during SEP/OCT across Argentina.


Fig. 6-7: La Nina temperature and precipitation anomalies for North America during SEP/OCT during moderate La Nina.


Fig. 8-9: La Nina temperature and precipitation anomalies for Europe during SEP/OCT during moderate La Nina.


Fig. 10-11: La Nina temperature and precipitation anomalies for Australia during SEP/OCT during moderate La Nina.


Fig. 12-13: La Nina temperature and precipitation anomalies for South America during SEP/OCT during moderate La Nina.
November/December: During moderate La Nina in VOV/DEC the U.S. averages near normal temperature with dryness in the Southeast. Europe is wetter and warmer than normal across the northern half while South-central Europe is dry. The wet and cool climate persists across northern and eastern Australia while southern areas are typically warmer than normal. Dryness continues across Brazil and Argentina shifts to a drier climate.


Fig. 14-15: La Nina temperature and precipitation anomalies for North America during NOV/DEC during moderate La Nina.


Fig. 16-17: La Nina temperature and precipitation anomalies for Europe during NOV/DEC during moderate La Nina.


Fig. 18-19: La Nina temperature and precipitation anomalies for Australia during NOV/DEC during moderate La Nina.


Fig. 20-21: La Nina temperature and precipitation anomalies for South America during NOV/DEC during moderate La Nina.