Graph Cast AI-Generated SLP Forecasts Continue To Out-Perform Conventional Models
12/30/2023, 7:51 am ESTSeveral Snowstorms Ahead in the East U.S.
01/03/2024, 12:37 pm EST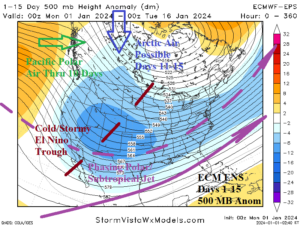
Fig. 1: ECM ENS 15-day projection of the prevailing upper air pattern across North America.
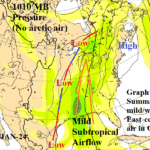
Discussion: A historic warm December 2023 featuring monthly temperature departures from normal of +8F to +14F across the North-central U.S. and >4F for almost the entire northern half of the U.S. are about to fade. North Atlantic oscillation (NAO) is getting ready to shift from values >+2.0 in Mid-December to an average of about -1.5 for January 5-17, 2024. Consequently, a blocking high pressure area over Greenland forces a strong longwave trough across Central Canada to the Southwest U.S. causing a snowy/colder January regime ahead (Fig. 1). The upper trough is amplified in intensity due to the phasing of both the polar and subtropical jet streams over the Southwest U.S. However, at least through 10 days, the westerly component of the 500 MB flow into the West Coast of North America implies lack of any arctic air and the cold weather generated is by the strength of the upper trough. There may be an arctic flow component to the pattern in the 11-15-day period. The pattern described is a snow maker but not unusual for mid-winter during El Nino when above normal snowfall is likely across the Great Basin, 4 Corners region, southern Plains, Tennessee Valley, and Northeast Corridor (Fig. 2). The largest storm to affect the East during the period is centered on January 9th. The Graph Cast AI-generated model has not been tested for intense winter storms in the U.S. (yet) and that will change during the first half of January. The Graph Cast AI forecast for January 9th indicates a rainy/windy El Nino storm in the East U.S. featuring excessive high wind in the Southeast/East U.S. likely to include severe thunderstorms in Florida and an ice storm in the interior Mid-Atlantic region (Fig. 3). Plenty of snow on the back side of the storm. Note chilly Pacific polar air on the back side of the storm enhanced by snow cover but “real” cold is well to the north over Western Canada. The ECMWF and GFS forecasts are reasonably similar emphasizing rain and wind near and east of the storm center with substantial snow on the back side of the storm with more arctic air in Canada than Graph Cast AI but staying north of the U.S./Canada border. Both ECM and GFS had warmer 24-hour temperature changes across Southern Canada in the 6-10-day period. 15-day snowfall forecasts by ECM and GFS are generally overdone (understatement). Important to natural gas markets to identify cold air risk in medium-range forecasts when arctic air is not present in the U.S. is where snow cover is located as to the attendant capability to enhance cold risk. One way to estimate that cold risk is the farthest southern extent of snow depth forecast by the GFS which indicates that on January 11th the snow cover (Fig. 4) extends southward across the entire Interior West, western Great Plains to the Missouri Valley, and the Appalachian States (away from the coast). Arctic air risk to the U.S. has diminished since last week. However, a cold and snowy El Nino storm track will change the pattern for January much colder as indicated by the colder trend from 72 hours ago of U.S. gas population weight HDD projections (Fig. 5).
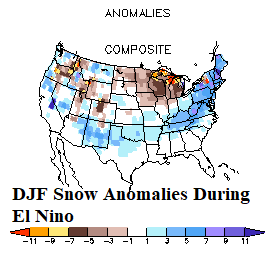
Fig. 2: NOAA/CPC El Nino climatology of snowfall anomalies for DED/JAN/FEB during El Nino.
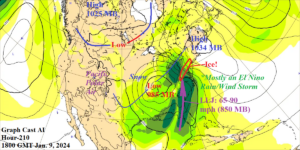
Fig. 3: Graph Cast AI-generated 210-hour SLP/850 MB wind forecast valid 1800 GMT on Jan. 9, 2024.
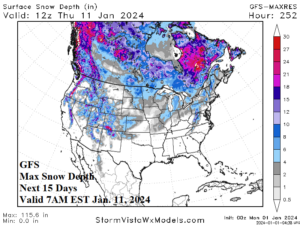
Fig. 4: GFS maximum southern extent of snow cover during the next 15 days valid at 7AM EST on Jan. 11, 2024.
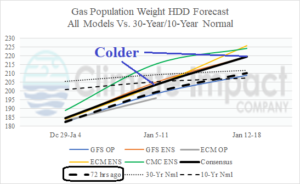
Fig. 5: Using all models, the U.S. gas population weight HDD forecast consensus and comparing with 72 hours ago and the 30-year/10-year normal.