El Nino Is Strengthening
06/27/2023, 10:36 am EDTMarine Heat Wave off West Coast of Europe Weakens and Signals Weather Pattern Change
07/05/2023, 5:35 am EDT

Fig. 1-2: Current U.S. soil moisture anomaly analysis reveals drought in the Northwest, Midwest, Texas, and the Mid-Atlantic region. The soil moisture change in June indicates a wetter trend over the western Great Plains is likely to shift eastward and into the Midwest drought area during July.
Discussion: A serious drought is spread across most of the U.S. Corn Belt as the middle month of meteorological summer approaches (Fig. 1). Drought is also present in Washington, redeveloping in Texas to Louisiana, and the Mid-Atlantic region. In general, the drought areas have intensified during June especially in the Midwest States and northwest Gulf of Mexico coastal region (Fig. 2). However, a wetter zone also emerged in June focused along and just east of the Continental Divide and across the western Great Plains. Operational forecasts in recent days have indicated the wet trend over the West-central U.S. during June will shift eastward and into the Midwest U.S. drought region in July, a somewhat unexpected regime change.
The latest NOAA/WPC 7-day quantitative precipitation forecast (QPF) indicates a swath of heavy rain across the U.S. Corn Belt featuring 5+ in. of rain for potential high amounts (Fig. 3). Much of the rainfall is delivered by severe thunderstorms including a major outbreak in Illinois today and the east/southeast Ohio Valley FRI/SAT. In the 8-14-day period, the excessively wet weather pattern continues. The GFS indicates a large swath of 2-4 in. of rain centered on Kansas and eastward to Indiana and Tennessee (Fig. 4). The rainfall indicated for the Midwest U.S. would eliminate at least half and possibly as much as 75% of the rainfall deficits currently present in this region.
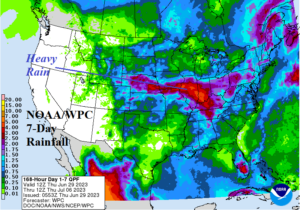

Fig. 3-4: The latest NOAA/WPC 7-day quantitative precipitation forecast for the U.S. projects a swath of heavy rain across the Midwest U.S. continued by the GFS in the 8-14-day period.
Many forecasters, including Climate Impact Company projected a summerlong drought in the Midwest U.S. The latest NOAA/CPC drought forecast reveals a similar outlook (Fig. 5). What happened to cause a wetter than anticipated pattern change, for the Midwest States?
Before looking at the current pattern and what may have changed, should we have known all along that the wetter pattern change would develop? The historical El Nino climate for JUN/JUL/AUG is wet across the Midwest U.S. (Fig. 6). El Nino onset was just announced by NOAA 3 weeks ago. However, the southern oscillation index (SOI) has shifted sharply negative (a strong sign of an El Nino climate) since late April/early May (Fig. 7). The 90-day SOI is -0.69 which is a dramatic (negative) shift from the long-standing very positive phase associated with the 2020-23 La Nina. The El Nino climate may have come on faster than anticipated. There are other macroscale climate changes occurring during early July such as a reversal in long-standing positive phase of global atmospheric angular momentum (GLAAM) to neutral phase (Fig. 8). The GLAAM shift implies a slowdown of the mid-latitude jet stream increasing risk of amplified (wet) trough patterns. The GLAAM shift is also likely related to developing El Nino.
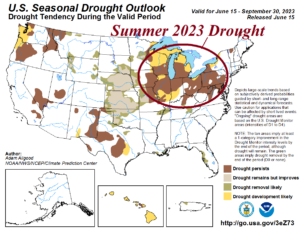
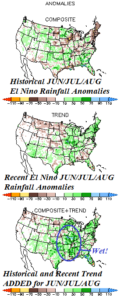
Fig. 5-6: The NOAA/CPC summer 2023 U.S. Drought Outlook and historical JUN/JUL/AUG El Nino rainfall climate in the U.S.
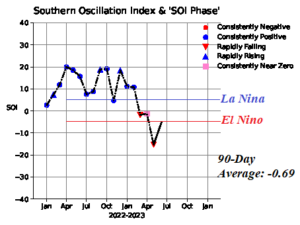

Fig. 7-8: Tracking the monthly southern oscillation index and the 15-day global atmospheric angular momentum forecast with 90-day history.
Since early spring, the dominant weather pattern affecting North America climate was a persistent upper trough in the vicinity of cool SSTA west-southwest of the U.S. West Coast and off the Northeast U.S. Coast (Fig. 9). In-between each trough, an amplified upper ridge caused the worst fire season on record in Canada and more recently an emerging Mexico/Texas ridge caused the recent super heat across ERCOT. The latest 15-day upper air forecast eliminates the two upper troughs on each U.S. Coast and the Canadian ridge. New dominant features include a weak ridge northeast of the marine heat wave (MHW) NEP23A north and northeast of Hawaii and a second ridge over East Coast Canada likely associated with a westward expanding MHW from the northeast North Atlantic basin (Fig. 10). The pattern change has left an energetic jet stream across the Midwest U.S. attached to a streak of energy (and moisture) from the tropical/subtropical Pacific to the south of Hawaii (Fig. 11).
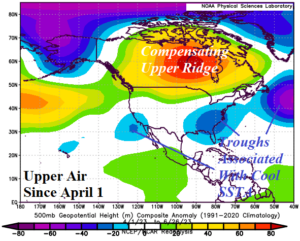
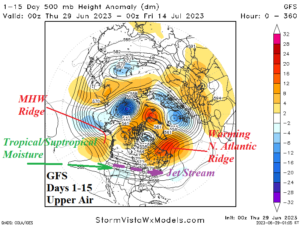
Fig. 9-10: The upper air pattern since April 1 is about to change in the GFS 15-day forecast.
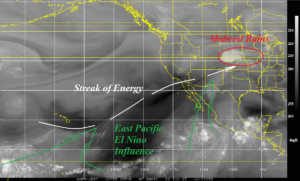
Fig. 11: Vapor satellite view of the East Pacific and dynamics present contributing to an over-achieving Midwest U.S. wetter pattern change.