Marine Heatwave Drives Rio Grande do Sul Extreme Rains
05/02/2024, 8:46 am EDTThe 2024 Severe Weather Season So Far; Second-most Tornadoes
05/15/2024, 9:20 am EDT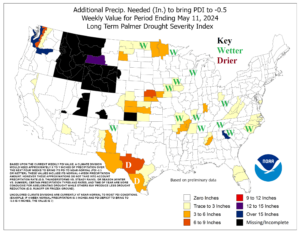
Fig. 1: Rainfall required to neutralize dry Palmer Drought Severity Index (PDSI) and weekly change to previous areas that were dry.
Discussion: For the week ending May 4, 2024, a total of 47 climate divisions east of the Continental Divide were present. Last week, 14 of these dry climate divisions observed a wetter change while only 2 were drier (Fig. 1). A total of 7 climate divisions with dry soil signatures shifted to neutral last week. The only drier zones were in southwest Texas where drought is intensifying while wetter changes were most dominant in the Midwest States.
Certainly, May 2024 is wet across the North-central U.S., Tennessee Valley and vicinity, and Gulf States (Fig. 2) with additional heavy rainfall for much of these areas ahead in the latest ECM ENS 15-day forecast (Fig. 3). The wet May 2024 is not unusual given the 2014-23 climatology which averaged wet across the southeast quadrant of the U.S. (Fig. 4) compared t a much drier pattern earlier this century (Fig. 5). The wetter trend during May is due to the rapidly warming subtropics vs. the lingering cool polar latitudes driving an energetic storm track across a much warmer than normal ocean surface propelled by marine heatwaves of the past decade.
During meteorological summer of the past 10 years, on average and somewhat independent of ENSO, the U.S. has maintained a wet climate signature across much of the South and East U.S. (Fig. 6). NOAA recognizes the new 10-year pattern as an optimum climate normal (OCN) and given the weak ENSO phase of the next 1-3 months (before La Nina arrives by late summer/early autumn) uses the OCN signature as the primary tool with their probabilistic precipitation outlook for meteorological summer (Fig. 7).
In summary, is the wet May anomalous? No, the wet pattern is likely to continue during the summer months for much of the eastern half of the nation. Tricky is the wet East/dry West dividing line as relevant to U.S. Crop Areas. The U.S. Corn Belt and soybean growing areas may be centered on that dividing line which can cause havoc to agriculture analysts, planners, and traders as crop conditions vary widely.
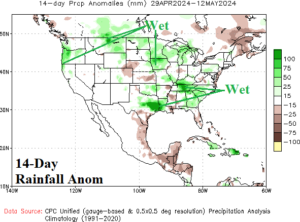

Fig. 2-3: The percent of normal rainfall across the U.S. for the past 2 weeks and 15-day rainfall anomaly forecast according to ECM ENS.
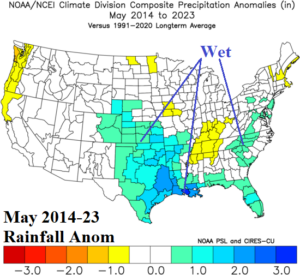
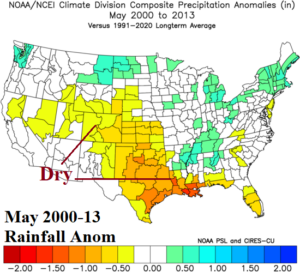
Fig. 4-5: The 2014-23 U.S. rainfall anomalies for May compared to 2000-13.
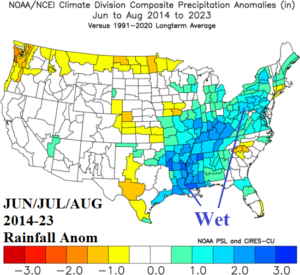
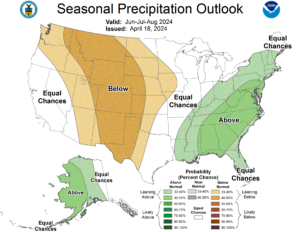
Fig. 6-7: The U.S. rainfall anomalies for JUN/JUL/AUG 2014-23 compared to the NOAA probabilistic rainfall forecast for JUN/JUL/AUG 2024.