To Date, U.S. Summer 2023 Not That Hot
08/24/2023, 8:24 am EDTTD 10 Becomes Tropical Storm Today, Likely Major Hurricane NE Gulf Later Tuesday
08/27/2023, 8:50 am EDT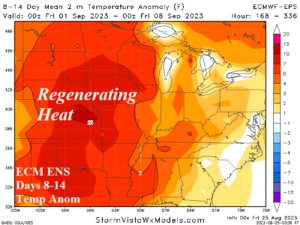
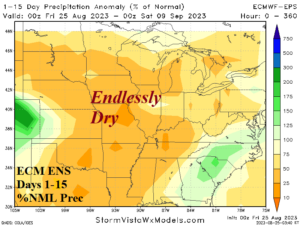
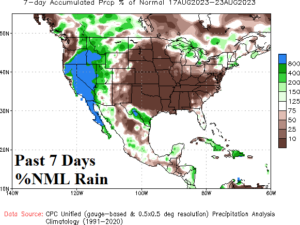
Fig. 1-3: ECM ENS 8-14-day U.S. AG Belt temperature anomalies and 15-day percent of normal rainfall plus the 7-day U.S. percent of normal rainfall observations.
Discussion: Areas most susceptible to re-intensifying drought or new drought are north/east Illinois and much of Arkansas, particularly east/south sections based on deep layer soil moisture anomaly deficit. The outlook is miserable for almost the entire Central/East-central U.S. as the current heat wave abates this weekend but re-emerges in the 8-14-day period (Fig. 1). Meanwhile, the 15-day outlook is endlessly dry throughout the region (Fig. 2) adding to rainfall deficit woes generated during the past 7-10-days (Fig. 3).
Madden Julian oscillation (MJO) is forecast to shift into the Indian Ocean in the 8-14-day period. As a result, the failed wet monsoon climate across India is likely to change. The GFS ENS indicates a plume of wet weather in the tropics extending northward into Central India in the 8-14-day forecast (Fig. 4). The MJO shift could also produce some rain in the extend-range to parts of Australia (Fig. 5).
West to Northwest Africa is turning wetter. Previously, the dry and hot regime in this sector contributed to the summer of 2023 hot/dry Europe ridge pattern leading to Southeast Europe drought. The wetter change is now contributing to an emerging showery pattern across Western Europe and making rainfall totals more buoyant (Fig. 6). The latent heat release from these convective rains is amplifying the upper ridge pattern to the east. Consequently, East/Southeast Europe and Black Sea hot and dry weather persists well into September (Fig. 7).
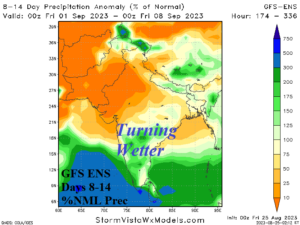

Fig. 4-5: GFS ENS 8-14-day percent of normal rainfall across India and 11-15-day projection for Australia.
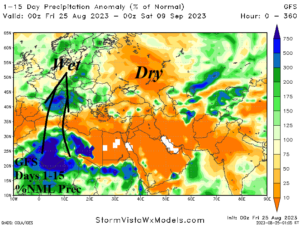
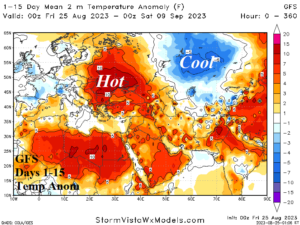
Fig. 6-7: GFS 15-day percent of normal rainfall and temperature anomalies across Europe and Western Russia.