The El Nino Ridge Warms Mid-winter in South America.
08/01/2023, 10:34 am EDTNOAA ENSO Forecast Models Still Uncertain About El Nino Strength but Agree On La Nina Back in 2024
08/07/2023, 12:01 pm EDT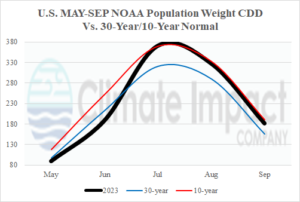
Fig. 1: U.S. population weight CDD is not that impressive for the 2023 warm season generally ranking below the last 3 warm summer seasons.
U.S. summer 2023 population weight forecast CDD discussion: The U.S. population weight CDD verification for July was 371. The value is similar to last year (373). Interestingly, the observation is very close to the 10-year normal but much warmer (by 50 CDD) than the 30-year normal. Except for July 2021 (400 CDD), the JUL-23 CDD value is close to the 2016-2022 prevailing climatology. JUL-23 ranked 11th hottest of this century. Prior to mid-summer, MAY-23 and JUN-23 each ranked coolest of this century. The August 2023 U.S. population weight CDD is projected at 327 CDD ranking 10th coolest of this century. The September 2023 projection is 182 CDD which is the 8th coolest of 2000-2022. The meteorological summer (JUN/JUL/AUG) 2023 CDD is 887 ranking the 8th coolest of this century. Only Texas and the Upper Midwest have observed warmer than normal temperatures so far during summer 2023 while California and the Intermountain West are cool and the East near normal. Probably the best statistic to identify the summer 2023 pattern so far are low natural gas prices (used to produce electricity for air conditioning).
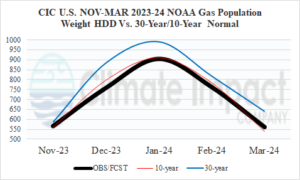
Fig. 2: The Climate Impact Company CDD anomaly forecast for each month of the 2023-24 cold season compared to the last 3 years indicates another mild winter.
U.S. winter 2023-24 population weight HDD forecast discussion: The U.S. gas population weight HDD for November 2023 is 567 which ranks 8th coldest in the 2000-2022 climatology. The NOV-23 projection has similarities to the past 2 years. The last cold front end of the winter season November’s was 2018 and 2019. NOV-23 is likely close to the 2000-2022 normal. In December, the U.S. gas population weight HDD projection is 759 which ranks 5th warmest this century. Last year was quite cold (883) while 2021 was mild (688). In 2023, December is right in the middle of the past 2 years but somewhat below normal national heating demand. Mid-winter brings the 10th warmest January in the 2000-2022 record of 905 HDD. Having similarities to December, the JAN-24 projection is in the middle of a cold 2022 (1003) and warm 2023 (811). February 2024 is projected as the 10th warmest of this century at 763 HDD. The last significant anomaly in February were the very warm years of 2016-2018. Finally, March 2024 is projected as the 7th warmest of this century at 562 HDD. The NOV-23 to MAR-24 U.S. population weight HDD is 3609 which is close to the 10-year normal (3629). The meteorological winter (DEC/JAN/FEB) 2023-24 U.S. population weight HDD is 2433 which is also similar to the 10-year normal (2459 HDD).