The Record Rains for Northern Australia in March
04/03/2024, 5:33 am EDTCloud Cover Forecast for April 8 Eclipse Update
04/07/2024, 9:45 am EDTHighlight: Colorado State University forecasts titanic hurricane season.
| Named Storms | Hurricanes | Major Hurricanes | ACE Index | |
| CSU | 23 | 11 | 5 | 210 |
| 30-Year NML | 14.4 | 7.2 | 3.2 | 123 |
| CIC | 20 | 10 | 5 | 189 |
Table 1: The Colorado State University 2024 North Atlantic basin tropical cyclone activity forecast compared to the 1991-2020 normal and previously issued Climate Impact Company forecast.
| Risk of at least land-falling major hurricane | Normal Risk | |
| Entire U.S. Coast | 62% | 43% |
| East Coast | 34% | 21% |
| Gulf of Mexico | 42% | 27% |
Table 2: The Colorado State University 2024 probability of at least one major hurricane striking the U.S. Coastline compared to normal risk.
| Named Storms | Hurricanes | Major Hurricanes | ACE Index | |
| 2005 | 28 | 15 | 7 | 245 |
| 1995 | 19 | 11 | 5 | 227 |
| 2004 | 15 | 9 | 6 | 227 |
| 2017 | 17 | 10 | 6 | 225 |
| 1950 | 16 | 11 | 6 | 211 |
Table 3: The most active 5 seasons in the North Atlantic basin since 1950.
Discussion: The Colorado State University North Atlantic basin tropical cyclone season activity forecast reveals a dangerous projection featuring an accumulated cyclone energy index (ACE) of 210, sixth highest since 1950. The outlook projects 23 tropical storms, 11 hurricanes, and 5 major hurricanes (Table 1). The outlook is slightly more active that last week’s Climate Impact Company forecast, and the initial forecast issued last December by Tropical Storm Risk/U.K. (their update is issued on April 8).
The Colorado State University probability forecast of (at least) one land-falling major hurricane is a whopping 62% for the U.S. Coastline, 19% above normal risk (Table 2). The probability forecast favors a major hurricane striking the coast slightly more than the East Coast.
The most active tropical cyclone seasons in the North Atlantic basin since 1950 based on ACE index are 2005, 1995, 2004, 2017, and 1950 (Table 3). Each year listed produced several land-falling U.S. hurricanes in the Gulf of Mexico.
The outlook is primarily focused on the record anomalous warm tropical and subtropical North Atlantic waters “as a primary predictor of 11 hurricanes”. Also cited is the transition from an El Nino climate now to a La Nina climate by AUG/SEP/OCT which is the peak of season for tropical cyclone activity. The La Nina climate lowers upper-level wind shear to allow tropical cyclone activity to develop and intensify.
Colorado State University cites 5 analog years: 1878, 1926, 1998, 2010, and 2020. The 2024 forecast is about 170% of the 1991-2020 normal (compared to 120% last year). Colorado State University will update their seasonal forecast on June 11.
Analysis: The record warm SSTA in the tropical/subtropical North Atlantic is the catalyst for the very active forecasts. The AUG/SEP/OCT 2024 projection of SSTA in the North Atlantic basin by the CFS V2 model strengthens the warm anomaly near and east of Puerto Rico (to +1.0 to +2.0C) which is in the heart of the main development region (MDR). In 2005, when 15 hurricanes and 7 major hurricanes formed, the SSTA in the region near and east of Puerto Rico was slightly cooler (+1.0C to +1.5C) than this year’s forecast. A recent recalculation of ENSO and tropical cyclone climatology revealed that moderate La Nina produces the most favorable (ENSO) climate pattern for North Atlantic tropical cyclones. Strong La Nina years have increased risk of tropical upper tropospheric troughs (TUTT) which can suppress activity. The 2024 ENSO outlook favors a transition to moderate strength La Nina during AUG/SEP/OCT. Forecasters are issuing very active tropical cyclone season outlooks in April. The concern is that forecast confidence on a favorable ENSO condition increases with June updates and causes already dangerous seasonal forecasts to be revised more active. Based on ACE index, the CSU forecast is the 6th most dangerous in the 1950-2023 climatology. A June revision putting the 2024 seasonal forecast into the top 3 busiest all-time is possible.
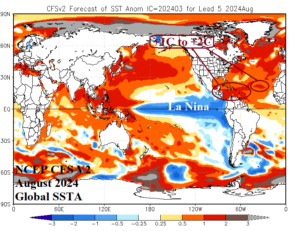
Fig. 1: NCEP CFS V2 forecasts potential for +1.0 to +2.0C in the North Atlantic tropics during August 2024.
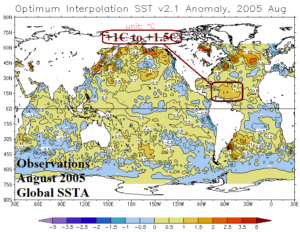
Fig. 2: SSTA in the western MDR reached +1.0C to +1.5C during August 2005.