Coolest Main Development Region for North Atlantic Hurricanes Since 1994
06/13/2018, 2:40 pm EDTPotential Implications of The Strongest Easterly Quasi-biennial Oscillation on Record
08/05/2018, 9:42 am EDTSummary: Frequent discussions issued by the Capital Weather Gang issued in the Washington Post do a nice job identifying dramatic weather events around the globe where weather observations are not-so-easy to find. Earlier this week articles published on all-time heat extremes occurring across a wide variety of northern hemisphere locations was recognized. What caused these extremes? Climate Impact Company attempts to explain.
Discussion: From late June to early July extraordinary record heat (often combined with high humidity) has been observed. A few of these locations listed by Capital Weather Gang are listed in Table 1.
| Location | Notes |
| Montreal | All-time record 98°F; 55 related deaths. |
| Northern Siberia | Computer simulations of >90°F on the coast of the Arctic Ocean; all-time record. |
| Ouargla, Algeria | 124°F; possible all-time record. |
| University of California at Los Angeles (UCLA) | 111°F; all-time record (July 6). Many all-time records Southern California. |
| Denver, CO | 105°F June 28; tied all-time record. |
| Parts of Scotland and Ireland | 85°F-92°F late June; all-time records. |
| Parts of Georgia and Armenia | 105°F-108°F in late June. |
| Quriyat, Oman | A global record LOW temperature of 109°F |
Table 1: Capital Weather Gang identifies historic heat/humidity records across the northern hemisphere from late June to early July.
Is there any climate diagnostic that helps to explain why this extreme heat occurred? Yes! An extreme negative phase of global atmospheric angular momentum (Fig. 1) COMBINED with drought and soil moisture trend (Fig. 2).
What is global atmospheric angular momentum? A complex concept but helpful (climate) diagnostic identifying the mean upper westerly flow especially in middle latitudes (where most people live and most crops are located). When the index is extreme negative as it has been the past 3-4 weeks the jet stream flow weakens and there is increased susceptibility of strong upper ridge patterns (Fig. 3) to develop which can produce heat extremes across or downwind drought areas. This is the situation leading into July…extreme –GLAAM coupled with drought and producing heat extremes.
While the strong –AAM index causing the large set of amplified upper air high pressure ridge areas in the northern hemisphere which (combined with drought) cause extreme heat help to explain what drove the historical heat observations, what caused the –AAM?
Given the extremes we’ve seen during late June/early July climate scientists will undoubtedly sink their teeth into this question. Climate Impact Company offers a preliminary explanation. Normally, strong AAM regimes are driven to extremes by an exchange of tropical energy surging pole ward best measured by presence of a strong Madden Julian oscillation (MJO) or shift in the El Nino southern oscillation and there are other mechanisms. However, Climate Impact Company recognizes what may be the leading contributor to northern hemisphere global climate during recent months (and extending through summer): The North Atlantic cool pool.
Beginning earlier this year and still intensifying is a large mass of cooler than normal ocean surface to the south of Greenland (Fig. 4). There is speculation that the cool pool is being driven by either Greenland ice sheet melt or a possible change in the long-term cycle of the Atlantic multi-decadal oscillation (or both).
Aloft the atmosphere is cool across and nearby this large mass of cooler than normal water creating a late season polar vortex which is shaping the northern hemisphere flow patterns causing an amplified ridge to the southwest (across the U.S.) and to the southeast/east (over parts of Europe). There are residual effects downstream across Asia.
Summary: Hostile thermal extremes have been observed for late June to early July across many sectors of the northern hemisphere. Many thanks to Capital Weather Gang for identifying the locations – they are not easy to assimilate. Climate Impact Company identifies the leading climate catalyst of the heat extremes to a hemispheric weather pattern in which many amplified upper air high pressure ridge areas formed to produce the heat (helped by presence of drought). The climate diagnostic that identifies the presence of the ridge areas is the negative phase of atmospheric angular momentum. While an anomalous heat exchange between the tropics and polar region is undoubtedly a cause of the –AAM pattern Climate Impact Company believes the great North Atlantic cool pool is the lead catalyst.

Fig. 1: Daily atmospheric angular momentum index provided by CWG/Storm Vista WX Models identifies the strong negative phase in mid-to-late June to early July (and the 15-day forecast [blue] ending this pattern).

Fig. 2: The most recent (May 2018) global soil moisture ranking percentile anomaly and 3-month trend provided by NOAA. (The June 2018 analysis will be available early next week).
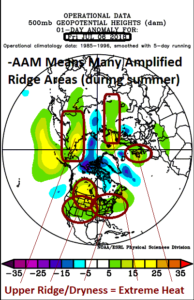
Fig. 3: The northern hemisphere 500 MB anomaly analysis for July 6 identifies where the atmosphere wants to produce extreme heat: Much of the U.S. into southern Canada, Western Europe, west to southeast Russia/Black Sea region and north/northeast Siberia.

Fig. 4: Global SSTA analysis for July 5, 2018 identifies the great North Atlantic cool pool – very unusual and not seen since decades ago. The cool pool is sustaining the polar vortex (aloft) while just to the south amplified upper ridge areas form associated with warm SSTA patterns driving U.S. heat.