Developing Deep Layer Soil Moisture Deficit and Late Summer Dryness/Heat Caused Southeast Brazil Flash Drought
04/27/2020, 8:59 am EDT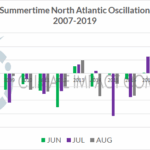
Persistent 2007-19 –NAO Pattern During Summer May Reverse for Summer 2020
06/12/2020, 1:39 pm EDT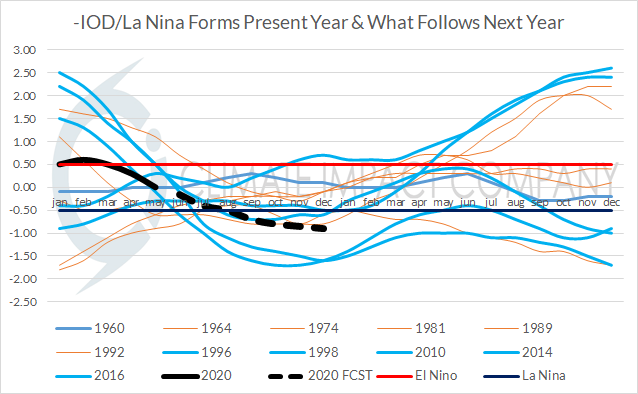
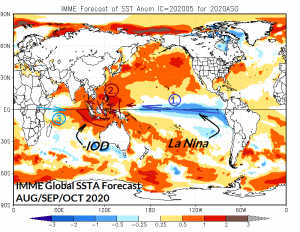
Fig. 1: The North American Multi-Model Ensemble global SSTA forecast valid for AUG/SEP/OCT 2020 identifying the emerging La Nina and negative phase Indian Ocean Dipole which will combine to produce major global climate impacts.

Fig. 2: The historical tendency of years when –IOD and La Nina form together and the typical ENSO pattern for year 2 ahead. The blue plots are recent years (since 1995) and orange plots are the much older analogs. In the “modern” climate La Nina has a tendency to return
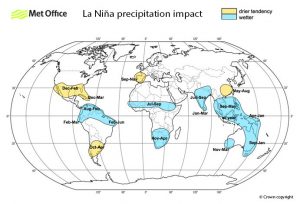
Fig. 3: The U.K. Meteorological Office depiction of global precipitation anomalies typical of a La Nina climate. The combination of –IOD/La Nina this year could enhance the anomalies indicated this year and cause them to return next year.
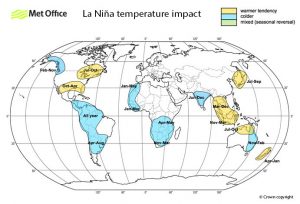
Fig. 4: The U.K. Meteorological Office depiction of global temperature anomalies typical of a La Nina climate. The combination of –IOD/La Nina this year could enhance the anomalies indicated this year and cause them to return next year.
Discussion: The Australian Bureau of Meteorology is forecasting a moderate-to-strong negative phase of the Indian Ocean Dipole (-IOD) to develop over the next several months peaking during AUG/SEP/OCT 2020 and coinciding with evolution of a La Nina episode. The tropical sea surface temperature anomaly (SSTA) pattern produced by –IOD and La Nina is indicated in the AUG/SEP/OCT 2020 global SSTA forecast by the North American Multi-Model Ensemble (Fig. 1).
Trade winds are becoming more established in the eastern equatorial Pacific Ocean up-welling cool subsurface water. Trade winds strengthen as the thermal gradient in-between the warm tropical waters of the West Pacific and cooling East Pacific tropics (also) increases. The westward warm push of surface water into the West Pacific tropics expands into the eastern Indian Ocean. Across the warm tropical waters convective clouds increase. Low level atmospheric flow to replace the rising air within the convection further enhances the easterly flow across the East Pacific tropics and causes a westerly flow to cool off the western Indian Ocean tropics (further enhancing the –IOD pattern).
The climate pattern produced by the oceanic and atmospheric processes described could be profound…ENHANCED La Nina climate with potential for La Nina to last into a second year.
The 2020 –IOD pattern will be the 12th since 1960. Each –IOD event was generated during neutral ENSO or La Nina (Fig. 2). Generally, neutral ENSO or La Nina persisted the remainder of the –IOD year. El Nino does not occur in –IOD years.
Interestingly, in the modern climate regime (past 2-3 decades when both the oceans and atmosphere have warmed) when –IOD developed and La Nina also generated the cold ENSO event had a tendency to be moderate to strong and last into the following year. The ENSO forecast in Fig. 1 combines the up-to-date Australian Bureau of Meteorology and NOAA/NCEP CFS V2 Nino3.4 SSTA projections for the next 5-8 months each agreeable to La Nina development. Presence of the –IOD pattern implies La Nina could be fairly strong and if so linger in 2021.
The risk of a stronger and longer La Nina suggests closer attention to the historical La Nina climate anomalies provided by the U.K. Meteorological Office (Fig. 3-4) as they may be stronger than usual (Table 1).
| Continent | Time of year | Climate ALERT |
| North America | Winter | Southern U.S. dry-to-drought and quite warm. Following warm season heat risk. |
| North America | Winter | Very cold Western Canada. |
| North America | JUL to OCT | Very warm Northeast U.S. |
| South America | AUG to FEB | Northern South America wet/flooding. |
| South America | OCT to APR | Argentina/Uruguay/ SE Brazil drought. |
| South America | All Year | Tendency for cooler than normal all but East Brazil. |
| Europe | SEP to NOV | Spain and Portugal drought. |
| Africa | JUL to SEP | Wet tropical Africa; frequent potent tropical waves into North Atlantic tropics |
| Africa | NOV to APR | Wet and cool! Long-standing drought ends for South Africa. Flooding becomes issue. |
| India | JUL to SEP | Wet (and cooling) Monsoon! Flooding/tropical cyclones. |
| Southeast Asia/Indonesia | Most of year | Wet! Flooding rains. May summer season typhoons. Warmer than normal tendency. |
| Asia | MAY to AUG | China drought. |
| Asia | JUL to SEP | Hot Japan. |
| Australia | Spring/Summer | Wet Southwest and East continent. East is cool. |
Table 1: U.K. Meteorological Office La Nina climate anomalies are likely enhanced due to evolution of La Nina with a –IOD pattern.
Summary: Evolution of La Nina during negative phase of the Indian Ocean Dipole suggest that the attendant convection patterns associated with this regime will be stronger and have a more dramatic impact on global La Nina climate. Both strength of La Nina climate anomalies could be stronger and La Nina could linger in 2021.
After a titanic tropical cyclone season in the North Atlantic tropics a drought develops next winter and lasts into 2021 across the South and Southeast U.S. In South America, Argentina to gar Southeast Brazil drought while far northern Brazil is soaking wet. South Africa drought ends; flooding rains evolve. A wet monsoon for India, Southeast Asia and Indonesia although China drought could develop. Australia is wet!
Big assist with this paper: New research published in the America Meteorological Society’s Journal of Climate titled “What Controls The Duration of El Nino and La Nina Events?” written by X. Wu, Y.M. Okumura and P.N. DiNezio (University of Texas).