Schedule of North Atlantic Seasonal Hurricane Forecasts for 2024
02/25/2024, 8:26 am ESTFinding Climate Change in Northern Hemisphere Wintertime Upper Air Pattern During El Nino
03/05/2024, 2:53 pm ESTExecutive summary: Presence of a semi-permanent marine heat wave in the Northeast Pacific and cool pool of water south of Greenland (North Atlantic warm hole) began during 2013-14 and maintained a strong presence for the following decade although slightly weaker during the past 4 years. The weaker signature of the past 4 years may be related to a lengthy La Nina (except for second half of 2023). Return of La Nina is expected this year. In this report, a constructed analog projects the prevailing upper air patterns across North America and Europe for each month of the warm season (MAY-SEP) and a summary projection for meteorological summer 2024 compared to NCEP CFS V2. The forecast is most confident over North America where elevated drought risk is forecast for the Great Plains and Canadian Prairies (Fig. 1). Forecast confidence is lower for the Europe outlook as timing of drought differs from summertime for Western Europe according to CFS (Fig. 2) to mid-to-late summer by the CIC forecast centered on France and the Black Sea region (Fig. 3).
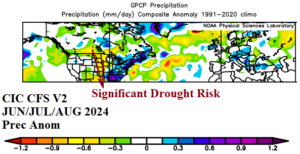
Fig. 1: The Climate Impact Company constructed analog projection of anomalous precipitation across North America and Europe for JUN/JUL/AUG 2024.
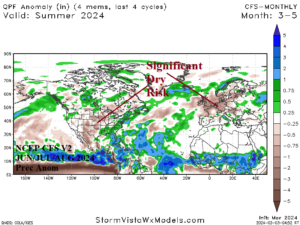
Fig. 2: The NCEP CFS V2 precipitation anomaly forecast for North America and Europe during JUN/JUL/AUG 2024.
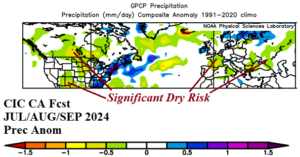
Fig. 3: The Climate Impact Company constructed analog projection of anomalous precipitation across North America and Europe for JUL/AUG/SEP 2024.
Overview: During the past 10 years, emergence of the Northeast Pacific marine heat wave (MHW) and North Atlantic warm hole (NAWH) SSTA patterns have contributed to the prevailing warm season (MAY-SEP) climate across North America and Europe. On average, summertime high pressure increasing risk of dry and hot climate has occupied western North America and parts of Western Eurasia. The climate pattern of the past 10 years is unique to the standard 30-year climatology therefore referred to as an optimum climate normal (OCN). The first part of the OCN (observed from 2014 to 2019) revealed a very distinct and predictable signature: Northeast Pacific ridge (over the marine heat wave), downstream weak trough over the Great Plains, ridge pattern on the U.S. East Coast, amplified trough over the NAWH pattern in the North Atlantic, and upper ridge over Europe (Fig. 4). During the past 4 years, the pattern is different as the Northeast Pacific MHW remains but has tendency to expand westward across the entire North Pacific while the NAWH pattern is weaker. The prevailing upper air of the past 4 years reveals upper-level ridging with a tendency to sprawl out from the North Pacific across Canada with the NAWH trough split between Greenland in central North Atlantic basin (Fig. 5).
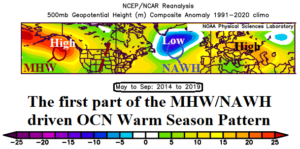
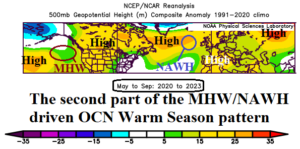
Fig. 4-5: The prevailing upper air pattern for two parts of the past 10-year optimum climate normal.
Current conditions: Currently, the global ocean SSTA is extremely warm with each basin warmer than normal (Fig. 6). The anomalous warmth is expected in the southern hemisphere due to the late warm season however the tendency for the northern hemisphere oceans to cool-off by late winter is minimal and ahead of the 2024 warm season, the North Pacific and North Atlantic are near record or record warm. The Nino SSTA monitoring areas are a robust warm +1.3C indicating El Nino has weakened slightly since the late 2023 peak. The closest correct projection of the current global SSTA condition by a forecast model is present using the NCEP CFS V2 (Fig. 7). Therefore, to project global SSTA driving the northern hemisphere warm season upper air pattern, application of the NCEP CFS V2 is applied (Fig. 8).
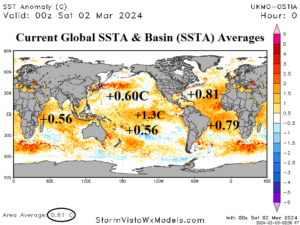
Fig. 6: Current global SSTA analysis and basin (SSTA) averages.
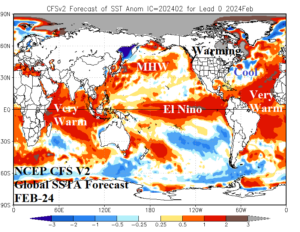
Fig. 7: NCEP CFS V2 initializes global SSTA forecasts for 2024 with the closest FEB-24 forecast compared to actual observations.
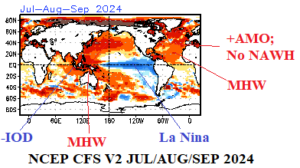
Fig. 8: NCEP CFS V2 global SSTA forecast for JUL/AUG/SEP 2024.
Forecast: The NCEP CFS V2 global SSTA forecast projects several key regional SSTA regimes affecting North America and Europe climate. First, NCEP CFS V2 is the most aggressive of all models projecting La Nina for late northern hemisphere summer. The subsurface upper ocean heat east of the Dateline is decelerating rapidly and supports the aggressive La Nina solution. Second, the Northeast Pacific MHW regenerates. However, similar with the past several years, the strongest warming associated with the MHW is near and west of the Dateline. Third, the NAWH pattern is weak to non-existent as the North Atlantic SSTA may be warmer than the record set last summer season. In the Indian Ocean, negative phase Indian Ocean dipole (-IOD) develops likely to enhance a La Nina climate. Based on this SSTA projection, an upper air pattern for MAY-SEP 2024 is likely very similar to a 2020-23 consensus biased toward the developing La Nina climate of 2020 and returning historical warmth to the North Atlantic SSTA in 2023.
Results: Based on a constructed analog, the projected upper air pattern for May 2024 across North America and Europe includes a well-defined pattern featuring a high amplitude high pressure over Canada to the Central U.S. and Western Europe and sharp trough patterns where the NAWH forms south of Greenland and another trough in Western Russia (Fig. 9). In this pattern, the west and north portion of the Midwest U.S. drought and Canadian Prairies strengthens. Drought in Northwest Africa spreads into Southwest Europe.
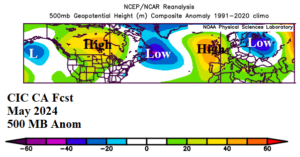
Fig. 9: CIC CA forecast of 500 MB anomalies for May 2024 across North America and Europe.
In June, the NAWH trough south of Greenland in May splits (Fig. 10). One center will shift to the Mid-Atlantic States while the primary low shifts north and intensifies over Greenland. The pattern is characteristic of positive phase North Atlantic oscillation (+NAO) favoring a warmer than normal climate for much of the U.S. and Europe. High pressure amplifies over Europe and remains widespread across Canada. A drying influence on climate emerges for much of Europe and Western Russia and continues across Canada. Canadian dry climate extends to the Northern U.S. Subtropical ridging emerges across the Rio Grande Valley where dry climate strengthens. An upper trough off Northwest Africa may cause some beneficial wet weather into the Northwest Africa and Southwest Europe drought areas.
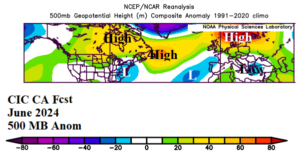
Fig. 10: CIC CA forecast of 500 MB anomalies for June 2024 across North America and Europe.
Mid-summer 2024 upper air pattern maintains distinct features including a change from high to low pressure over Northern Europe as the NAO pattern reverses (Fig. 11). The NAWH low pressure area settles southward toward Bermuda. In-between each low-pressure area, a strong subtropical ridge is drying and heating Southern Europe and North Africa. An upper ridge is broadly present across western North America where dryness and anomalous heat are strongest for mid-summer.
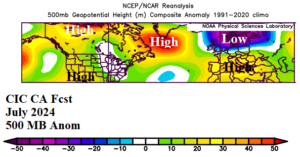
Fig. 11: CIC CA forecast of 500 MB anomalies for July 2024 across North America and Europe.
The late summer 2024 upper air pattern maintains an upper ridge over western North America (Fig. 12). The strong ridge of mid-summer across Southern Europe splits with one center over Spain and a second center amplifying over West-central Russia. W weak trough causes late summer wet weather in the East U.S. and Central Europe. August is likely very active in the North Atlantic basin for tropical cyclones.
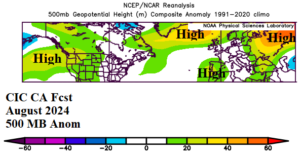
Fig. 12: CIC CA forecast of 500 MB anomalies for August 2024 across North America and Europe.
Late in the 2024 warm season, sprawling high pressure is projected across much of North America and amplifying in Europe (Fig. 13). The upper air forecast indicates +NAO returns which supports anomalous warmth in the U.S. and Europe. The strength of the high-pressure area over Europe strongly supports a dry and hot climate for late calendar summer and similar conditions for much of the U.S. while the East Coast is susceptible to tropical cyclones.
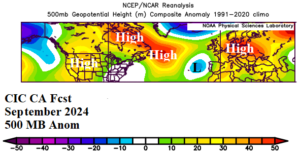
Fig. 13: CIC CA forecast of 500 MB anomalies for September 2024 across North America and Europe.
Summary: The Climate Impact Company constructed analog (CIC-CA) upper air forecast for JUN/JUL/AUG 2024 across North America and Europe, on average, features high pressure centers over Alberta, south of Greenland, Northwest Africa, and Northwest Russia (Fig. 14). Low pressure areas are located over the Mid-Atlantic U.S. and Canary Islands. The projection is based on rewarming of the Northeast Pacific although warmest SSTA extends from that region westward past the Dateline with a stronger signature. Consequently, the Northeast Pacific ridge pattern is most amplified farther west than usual near the Dateline. The NAWH pattern is present during the early warm season but will weaken mid-to-late summer. Therefore, high pressure becomes located south of Greenland and the NAWH trough is weak and shifts to near the Canary Islands. The downstream effect of the MHW/NAWH-driven features described include an upper ridge across western North America and Canada. Additionally, an upper ridge over Southwest Europe and Western Russia during meteorological summer 2024 is expected.
Comparing CIC-CA and NCEP CFS V2 upper air forecasts for JUN/JUL/AUG 2024 yield similar results of the Northeast Pacific MHW upper ridge as the core of this feature is located farther west than usual while the weak NAWH trough pattern is near the Canary Islands. However, differences are indicated with the residual pattern as high latitude high pressure is favored by both models but have different locations of the high-pressure centers which make a difference in where drought risk is highest.
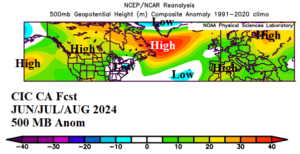
Fig. 14: CIC CA forecast of 500 MB anomalies for JUN/JUL/AUG 2024 across North America and Europe.
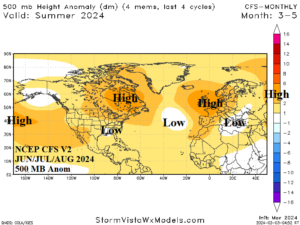
Fig. 15: The NCEP CFS V2 upper air projection for JUN/JUL/AUG 2024 across North America and Europe.
Conclusions: The JUN/JUL/AUG 2024 precipitation anomaly forecasts based on the upper air patterns discussed in this report strongly favor a dry climate causing increased drought risk in the Central U.S. as both CIC-CA and NCEP CFS V2 are agreeable to this solution (Fig. 16-17). The U.S. East Coast is soaking wet. The Canadian Prairies stay mostly dry therefore drought worsens. In Europe, forecast confidence is below average. The NCEP CFS V2 is supportive of Western Europe drought whereas the CIC-CA forecast favors drought risk later in the season (JUL/AUG/SEP) centered on France and the Black Sea region. Influence of the Northeast Pacific MHW and NAWH SSTA patterns is weaker in 2024 than 2014-23.
Fig. 16: The CIC-CA precipitation anomaly projection across North America and Europe for JUN/JUL/AUG 2024.
Fig. 17: The NCEP CFS V2 precipitation anomaly projection across North America and Europe for JUN/JUL/AUG 2024.