Mid-Atlantic Heavy Rain Event More Likely Based on 12Z GFS
09/20/2023, 1:44 pm EDTWarm Mid-latitude Oceans Bias Climate Warm
09/25/2023, 2:46 pm EDT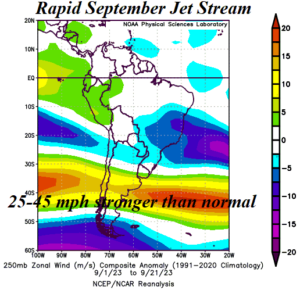
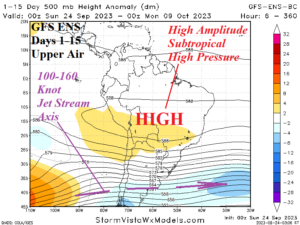
Fig. 1-2: Zonal wind speed anomalies across South America for September (so far) and the 15-day 500 MB height forecast.
Discussion: During September 2023 the jet stream axis across Argentina has averaged 25-45 mph stronger than normal (Fig. 1). The 15-day forecast maintains the rapid jet stream forecasting 100-160 knots across Argentina (Fig. 2). Meanwhile, just the opposite pattern counters that fast upper flow with titanic high pressure featuring much lighter than normal wind across Brazil. The dynamic forcing caused by the fast upper flow over Argentina with the amplified high-pressure ridge to the north causes extreme heat and mostly very dry climate in Brazil well into October.
After a wet 4-6-week period during August into early September caused by the northeastward extension of the Amundsen Sea low pressure area from southwest of South America across Argentina, the pattern has changed dramatically. During the past week a much drier climate has emerged across much of Brazil and Argentina (Fig. 3). Soil moisture trend is reversing much drier of late for much of South America with exception of a wetter trend caused by rains from earlier spring in East-central/Southeast Brazil (Fig. 4).
The very dynamic upper air pattern described leads to an extremely hot and dry 15-day forecast for Brazil (Fig. 5-6). The exception is wet risk in coastal Southeast Brazil although the mechanism to produce that rain is questionable and likely delayed until the 11-15-day period. The ECM Week 3-4 forecast maintains the dry and hot Brazil regime through most of October (Fig. 7-8).


Fig. 3-4: Past 7 days percent of normal rainfall across South America and the daily soil moisture analysis by NOAA for South America with annotated September changes.


Fig. 5-6: The GFS ENS bias correction temperature anomaly forecast across South America plus the GFS ENS MAXRES 15-day precipitation anomaly forecast.
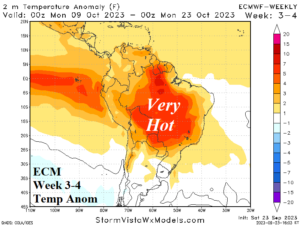
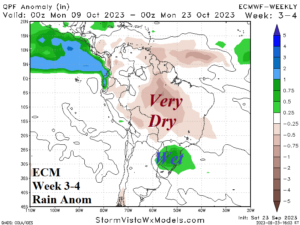
Fig. 7-8: The ECM week 3-4 ahead temperature and precipitation anomaly forecast across South America.