Where Did The Northern Hemisphere Upper Air Pattern Originate?
11/01/2023, 4:50 pm EDTEl Nino Support (Upper Ocean Heat) Remains Steady
11/06/2023, 10:08 am EST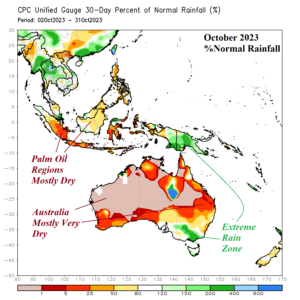
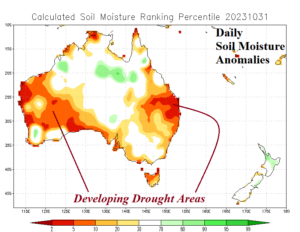
Fig. 1-2: The percent of normal rainfall for October across Southeast Asia, Indonesia, and Australia plus the daily soil moisture anomalies for Australia.
Discussion: The October 2023 rainfall pattern across Southeast Asia, Indonesia, and Australia featured extremes (Fig. 1). The expected weather was dry climate due to El Nino. However, inclusion of an intensifying positive phase of the Indian Ocean dipole (+IOD) lead to mixed observations. Heavy rains were observed in parts of Burma and Thailand plus South Coastal China and Eastern Indonesia. Elsewhere arid conditions were observed across Southwest Indonesia and much of Australia. The Northern Australia rainfall was among the lowest 5 for October since 1900 according to Australia Bureau of Meteorology. Soil moisture conditions are drying-out across Australia where drought is developing in parts of the west, south coast, and eastern continent (Fig. 2).
The mega-cluster ensemble indicates the “most likely” anomalous hot weather zone is across the western and southern portion of the continent through the next 5 days (Fig. 3). A wet weather event is forecast on the East Coast lasting through the weekend (Fig. 4). In the 6-10-day period, the anomalous hot weather risk is widespread beneath high pressure across central and southern continent (Fig. 5). The mega-cluster ensemble indicates patchy shower/thundershower areas extending from eastern parts of Western Australia and into New South Wales (Fig. 6). The wet weather indicated in the 6-10-day period is not enough to suppress expanding drought risk. In the 11-15-day forecast, heat risk is suppressed (Fig. 7) and forecast confidence is 50% indicating a showery regime from northwest to southeast continent (Fig. 8).
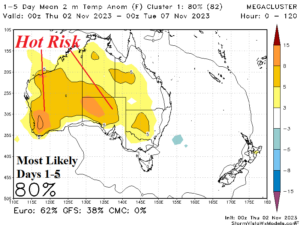
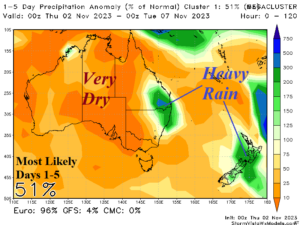
Fig. 3-4: Mega-cluster ensemble “most likely” temperature anomaly and percent of normal rainfall across Australia for the next 5 days.
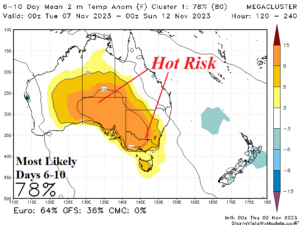
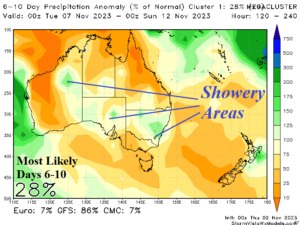
Fig. 5-6: Mega-cluster ensemble “most likely” temperature anomaly and percent of normal rainfall across Australia for the 6-10-day period.
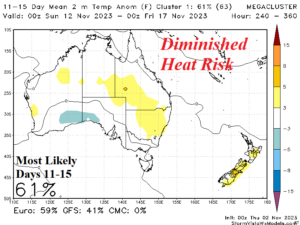
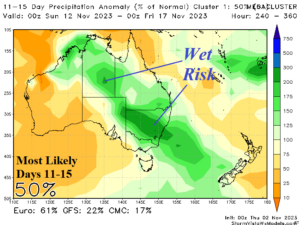
Fig. 7-8: Mega-cluster ensemble “most likely” temperature anomaly and percent of normal rainfall across Australia for the 11-15-day period.