Kansas Drought Worsening; Incoming Rains Miss Southwestern Kansas
04/26/2024, 3:44 am EDTSearing Heat and Drought Continue in Southeast Asia
05/01/2024, 8:27 am EDTA review of 2024 hurricane forecasts and status of the predictors issued on Tuesday.
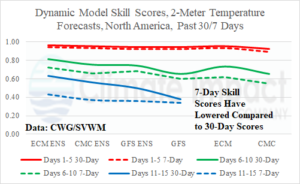
Fig. 1: 30-day and 7-day temperature forecast skill of leading dynamic models for North America. 7-day skills scores have lowered due to pattern change.
Discussion: Dynamic meteorological models generally have increased error during the cold-to-warm transition season. The 30-day skill scores of leading models are generally consistent with long-term averages for this time of year. However, the short-term (7-day) forecast skill has recently lowered (Fig. 1). Lowering skill score is usually explained by pattern change. During the past 7 days, the eastern half of the U.S. turned much cooler (Fig. 2) compared to the nationally warm average for the first 3 weeks of April (Fig. 3).
As an explanation for the East U.S. chill, the western North Atlantic basin has cooled recently (Fig. 4) likely foreshadowing the cooler pattern change. The 7-day western North Atlantic SSTA change is a moderately impressive -0.32C (Fig. 5). More impressive, and possibly shocking to hurricane forecasters projecting a record number of tropical systems in 2024, is the 1-year change showing the much cooler regime across most of the North Atlantic (Fig. 6).
A similar issue is observed in the North Pacific. The western North Pacific is warm (and warming) while the eastern Pacific is temperate or cooler than normal (Fig. 7). The SSTA pattern is reflected in the upper atmosphere with high-pressure across warmer waters compensated for by low pressure over the cooler waters of the northeast Pacific and responsible for a persistent upper trough on the U.S. West Coast through early May.
The cooler SSTA character of the eastern North Pacific and western North Atlantic leads to a transitional U.S. temperature pattern into mid-May. Featuring are cooler changes in the West this week forcing a briefly warmer change back into the East (Fig. 8), followed by the cooler weather returning to each coast during the medium range (Fig. 9-10). The recent lowering of temperature forecast skill by dynamic models is likely to continue in the transitional pattern ahead.
Interestingly, while short-term HDD and CDD forecasts are of no interest to natural gas markets during mid-spring, CDD totals are above normal and trend warmer during early May (Fig. 11).


Fig. 2-3: U.S. 7-day and 30-day temperature anomaly analysis.
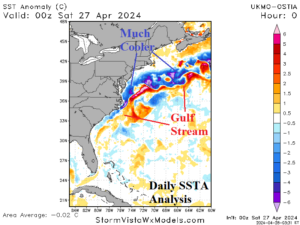
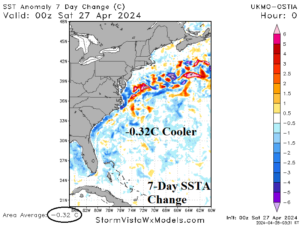

Fig. 4-6: Current western North Atlantic basin SSTA analysis, the 7-day change, and 1-year change.
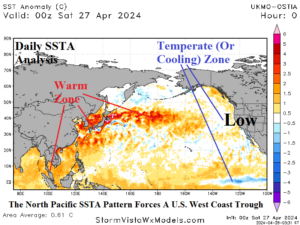
Fig. 7: The North Pacific daily SSTA analysis.

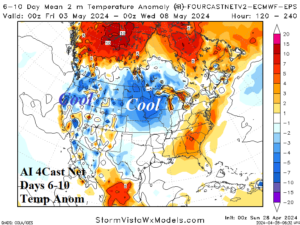
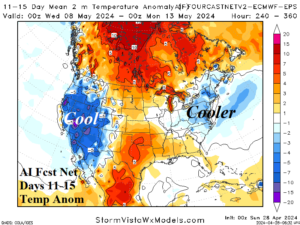
Fig. 8-10: The AI 4Cast.Net from ECMWF indicates a transitional 15-day temperature anomaly pattern across North America.

Fig. 11: The U.S. population weight CDD forecast utilizing all models, their consensus, and comparison with 48 hours ago and 30-year/10-year normal.