The Ocean/Atmosphere July Pattern Change Affecting Europe Climate
08/01/2023, 7:52 am EDTJuly 2023 and 2023 (So Far) State Temperature and Precipitation Rankings
08/08/2023, 7:45 pm EDT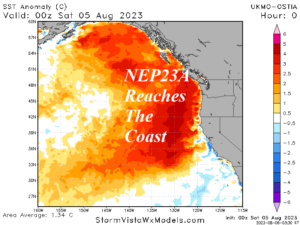
Fig. 1-2: The Northeast Pacific marine heat wave strengthens shifting to the coast.
Discussion: The Northeast Pacific marine heatwave (NEP23A) has shifted east and reached the Alaska, Canada, and Northwest U.S. Coast (Fig. 1). The warming near the coast during the past 30 days is immense (Fig. 2). The MHW has been semi-persistent since late 2013 and the 10-year historical correlation to the upper air pattern is to produce an upper-level ridge. Consequently, Climate Impact Company (CIC) is advising an increased tendency for upper-level ridging in northwest/west portions of North America heading toward autumn. Forecast models are (generally) disagreeable on this concept. CIC favors the mega-cluster ensemble which projects increasing Northeast Pacific high-pressure ridging while the downstream upper trough centered on Southwest Ontario holds (Fig. 3-4). Other models have the trough farther west with a warming ridge to the east affecting the eastern half of the U.S. in the 8-14/11-15-day period. CIC is doubting that aggressive projection (unless a significant tropical cyclone forms).
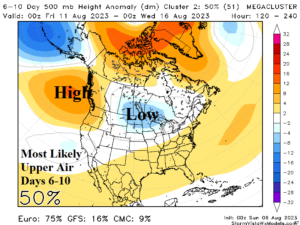
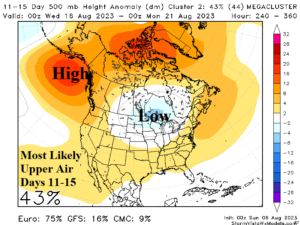
Fig. 3-4: The mega-cluster ensemble Northeast Pacific upper air forecast.
Currently, the most vivid high impact weather, is across the Southern U.S. where Excessive Heat Warnings affect 6 states from California to Alabama (Fig. 5). Steadily, heat enhancing drought is worsening. This week features a heavy rain/severe thunderstorm arc to the north of the excessive heat and centered on the Midwest U.S. to Ohio/Tennessee Valley(s), and throughout the Northeast Corridor (Fig. 6). Several inches of rain causing flash flooding are possible within the thunderstorm arc.
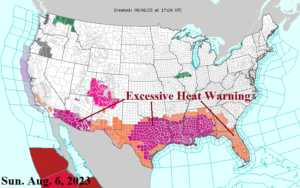
Fig. 5: NOAA/NWS weather watch, warning, and advisory areas.
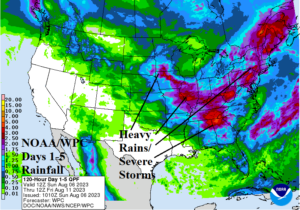
Fig. 6: The NOAA/WPC 5-day U.S. rainfall forecast.
The U.S. population weight CDD forecast by all models has a consensus projection similar to 48 hours ago (Fig. 7). However, the just run 12Z GFS was much warmer for the Aug, 18-24 timeframe.
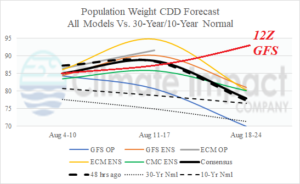
Fig. 7: U.S. population weight CDD forecast utilizing all models, their consensus, and comparing with 48 hours ago and the 30-year/10-year normal.