NOAA ENSO Forecast Models Still Uncertain About El Nino Strength but Agree On La Nina Back in 2024
08/07/2023, 12:01 pm EDTGlobal Soil Moisture Trend and Forecast Report
08/09/2023, 8:17 am EDT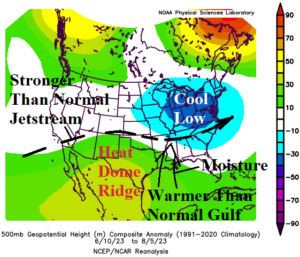
Fig. 1: The prevailing upper air pattern since June 10th associated with an unusual amount of severe weather reports.
Discussion: The Mid-Atlantic U.S. observed their warmest JAN-APR period on record earlier this year. However, in May the pattern changed. Rapid runoff of Northeast Canada snowmelt and the Greenland ice sheet deposited into the Labrador Sea and was transported south and southeast (by the Labrador Current) to create a large cool pool of water (relative to the surround environment) creating the semi-permanent North Atlantic warm hole (NAWH). Aloft, the atmosphere responded by producing an upper trough that reversed the East Coast thermal pattern to cooler than normal for late spring/early summer. To compensate, the already buoyant upper ridge over Canada amplified and worsened the historic fire season underway across that nation. Since the middle third of June, the upper trough shifted inland dropping anchor on the eastern Ohio Valley (Fig. 1). To the south, a large heat dome steadily evolved over Mexico stretching to Texas causing historic heat from the northwest Gulf States to Arizona. In-between the heat dome and the Ohio Valley trough sharp thermal contrast has driven an unusually energetic jet stream. Short wave troughs traveling along the jet stream core has produced unusually strong severe weather events since June 11th enhanced by moisture inflow from the much warmer than normal Gulf of Mexico. Since June 11th, a total of 15 days has produced near 500 or more severe storm (damage) reports (Fig. 2). More than 25% of the time during this 8-week period, a day when an unusual amount of severe weather has generated. The highest total of severe weather reports was 1,049 occurring yesterday most concentrated over the Mid-Atlantic and Southeast U.S. Nearly 20% of the reports were hail, unprecedented for an August event. June 25th and July 28th produced well over 900 reports. During the first half of the period, severe weather events were more frequent. Lately, severe weather events are not quite as frequent but more powerful (likely related to the super warm Gulf of Mexico).
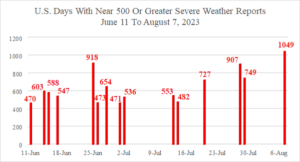
Fig. 2: Since June 11th, a total of 15 days has produced near 500 (or greater) number of severe weather reports.