An Update on The El Nino Southern Oscillation 2022
03/24/2022, 8:36 am EDTCause Of The Historic India Heatwave
05/05/2022, 12:21 pm EDT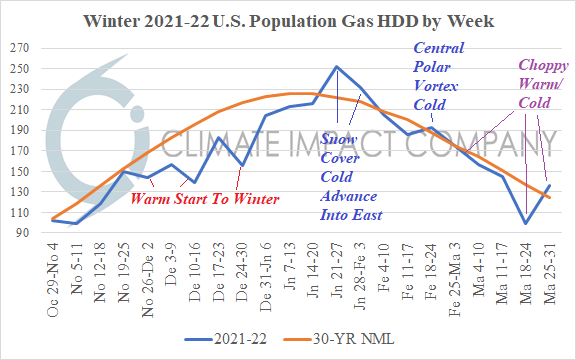
Winter 2021-22 Review: Warm start, choppy cold followed. Drought 2022 concern. (Please see appendix for 20 winter charts)
Executive summary: The cold season for 2021-22 offered a lot of variety most of which was not friendly to the natural gas market. The cold season started with a very warm climate feature record warmth in December. However, the mid-winter when temperatures are coldest observed a reversal in the pattern featuring top-third cold in the high energy demand northeast quadrant of the U.S. February brought a “polar vortex” cold outbreak surging into Texas and pulsing across the East followed by another cold shot in early March. Winter 2021-22 can be characterized as a warm start followed by choppy cold. The precipitation regime during quarter 1 of 2022 is 7th driest on record and has aggravated drought conditions in the West and Central U.S. which is a warm season 2022 concern for anomalous hot weather development that could spread across much of the U.S.
Discussion: November and December 2021 did not foreshadow the character of the mid-winter weather pattern across the U.S. especially for the high energy demand region of the Northeast U.S. November was the 7th warmest on record followed by the warmest December in the 1895-2021 climatology! In January, cold weather struck the northeast quadrant of the U.S. ranking in the top 25% (coldest) for New York/New England and top 33% (coldest) for the Upper Midwest/Ohio Valley. February averaged exactly normal from a national perspective. The cold target in February was Texas ranking 22nd coldest on record and not far away from the 11th coldest February for Texas recorded in 2021. March averaged 26th warmest on record with some winter cold lingering in the Central U.S. where temperatures averaged closer to normal.
Of course, there were extreme thermal regimes on a weekly basis. The first exceptional warm week in the East was Dec. 12-18 when record warmth was observed in Texas/Oklahoma and “much above” normal temperatures covered the Central and East States averaging +9F to +15F in that sector. Although the East cooled slightly, the very warm pattern persisted Christmas Week in the Central U.S. including record warmth in Wyoming. The week of Dec. 26 to Jan. 1 was a sign of pattern change ahead. While South and much of the East were extremely warm, at the same time arctic cold dipped into the northwest Great Plains. The big chill moderated to near normal into the East U.S. during the first half of January due to lack of snow cover and the warm Great Lakes. The first cold week of winter in the East was Jan. 16 to Jan. 22 which was marginally cold averaging normal to several degrees F below normal. A snow cover increase lead to a colder than normal last week of January in the East. January 21-27 produced a national gas population weight HDD value of 252 (30-year normal 222) which was the highest weekly value of the season. Warmth returned for a brief period in early February followed by the “polar vortex” outbreak of winter 2021-22 which struck the Central U.S. Feb. 20-26. Remarkably, the U.S. pattern reversed much warmer than normal Feb. 27-Mar. 5 and reversed again the following week when “much below” normal temperatures returned to the Central U.S. The mid-March Central chill eventually shifted into the East to close the month.
There were many lessons learned from the temperature pattern described. Due to the changeable nature of the weather pattern and the willingness to produce extremes any judgement on how winter will go based on early winter temperature regimes is ill-advised. Snow cover presence is required for important cold risk. There is a tendency for snow cover to develop late (in the U.S.) which implies cold-air build-up held in snow-covered Canada can be extreme. Once that cold is released into the U.S., an extreme outbreak can occur. The January cold outbreaks were moderated by the lack of established U.S. snow cover and relatively warm Great Lakes. However, once into February with snow cover established and the Great lakes cooling off to at least partial ice cover, cold outbreaks occurred inspired by a “polar vortex” weather pattern. The cold target this year was mainly the Central U.S. from the Dakotas to Texas. Short periods of cold occurred in the East as the air mass moderated with an eastward shift. The February cold pulses extended to March, typical of longer winter seasons in recent years although choppy warm and cold extremes returned in late calendar winter.
Quarter 1 of 2022 has been the 7th driest on record. There is significant concern that expanding drought is ahead for the U.S. warm season. Drought is well-correlated with anomalous heat and sometimes a feedback relationship is produced where large areas of dry soils make a hot regime hotter which in-turn strengthens drought. This set of circumstances is quite possible over California, the Southwest, West-central and Central U.S. (to Texas) for the warm season ahead. California and Nevada have experienced their driest quarter 1 of the year on record. Energy and agriculture markets (and many other industries) would experience supply and cost hardship(s) if this pattern validates.
Appendix: The Winter 2021-22 Charts
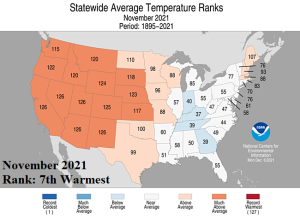
Fig. 1: The U.S. November 2021 state rankings for temperature.
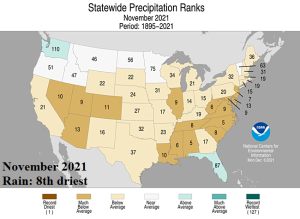
Fig. 2: The U.S. November 2021 state rankings for precipitation.
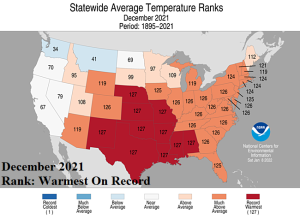
Fig. 3: The U.S. December 2021 state rankings for temperature.
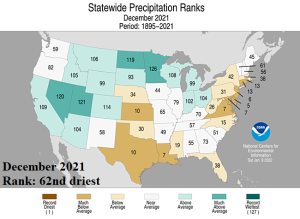
Fig. 4: The U.S. December 2021 state rankings for precipitation.
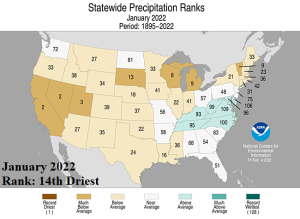
Fig. 5: The U.S. January 2022 state rankings for temperature.
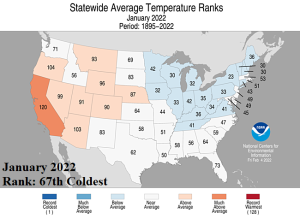
Fig. 6: The U.S. January 2022 state rankings for precipitation.
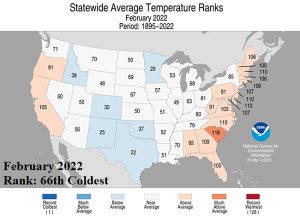
Fig. 7: The U.S. February 2022 state rankings for temperature.
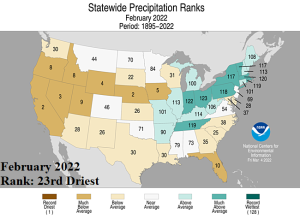
Fig. 8: The U.S. February 2022 state rankings for precipitation.
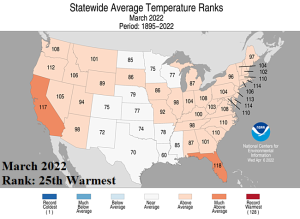
Fig. 9: The U.S. March 2022 state rankings for temperature.
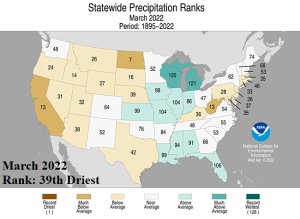
Fig. 10: The U.S. March 2022 state rankings for precipitation.
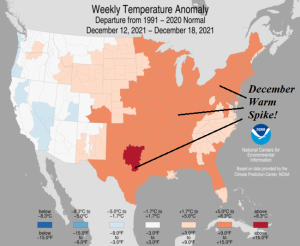
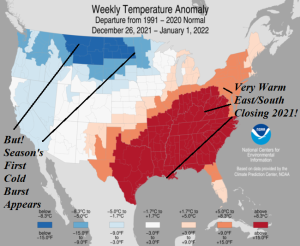
Fig. 11-12: Weekly U.S. temperature anomalies for Dec. 12-18, 2021 and Dec. 26, 2021 to Jan. 1, 2022.
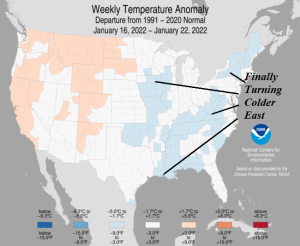
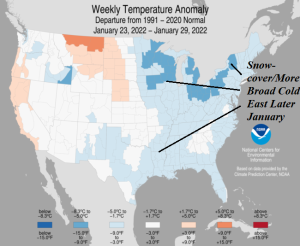
Fig. 13-14: Weekly U.S. temperature anomalies for Jan. 16-22, 2022 and Jan. 23-29, 2022.
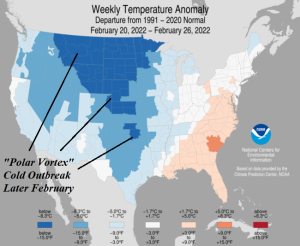
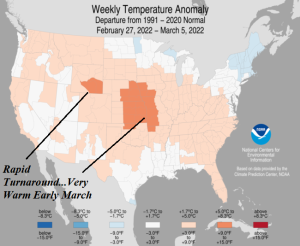
Fig. 15-16: Weekly U.S. temperature anomalies for Feb. 20-26, 2022 and Feb. 27-Mar. 5, 2022.
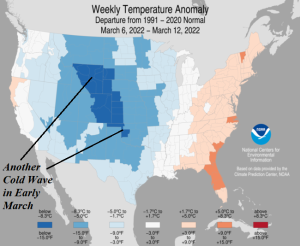
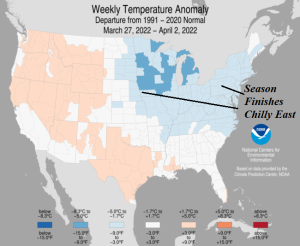
Fig. 17-18: Weekly U.S. temperature anomalies for Mar. 6-12, 2022 and Mar. 27-Apr. 2, 2022.
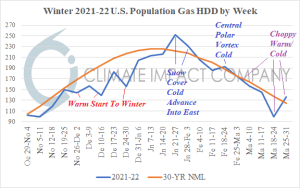
Fig. 19: U.S. gas population weight HDD for each week of the 2021-22 cold season with annotations identifying the regime.
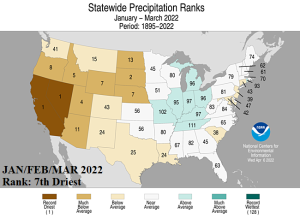
Fig. 20: U.S. state rankings of precipitation for quarter 1 of 2022.