11/14/2025, 12:49 pm EST
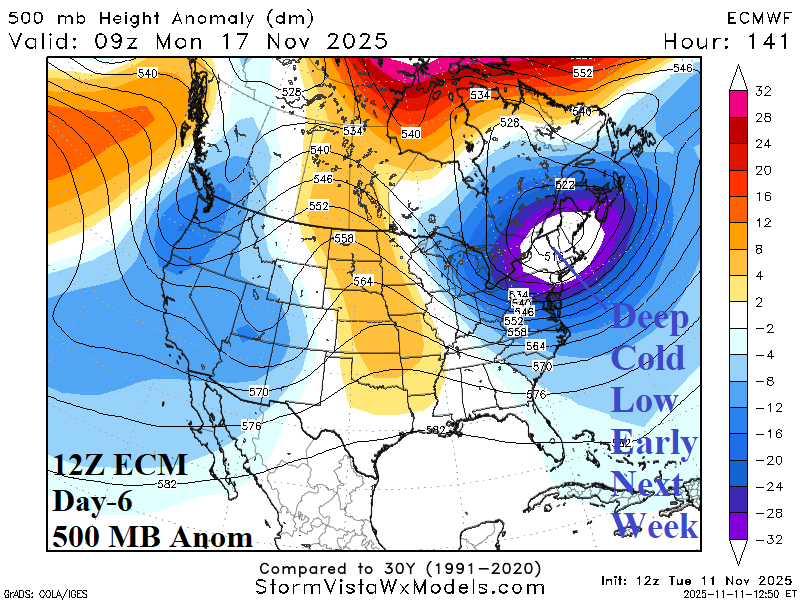
At midday, the 12Z GFS forecasts a whopping -4 value for the East Pacific oscillation (EPO) during the 11-15-day period. Other models are averaging -2 at that timeframe, about half the strength (although still impressive). The strong (-4) index supports arctic air involvement and on day-15, 12Z GFS indicates zero for morning low temperatures from Colorado to South Dakota. Is the forecast overstated?

