06/02/2025, 12:47 pm EDT
A map of the ocean AI-generated content may be incorrect.

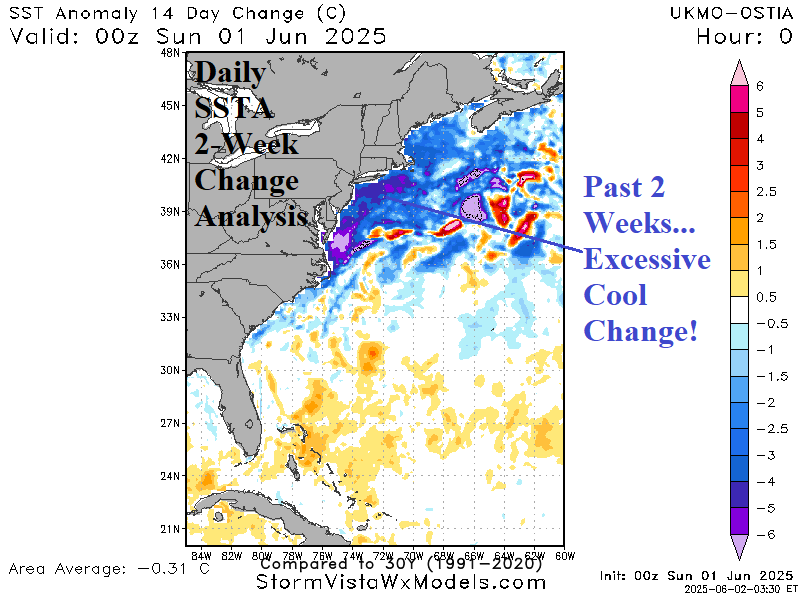
Dramatic Cool Change to Ocean Surface Off Northeast U.S. Coast

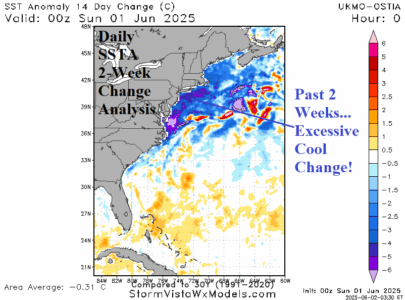
The ocean surface off the Northeast Corridor Coast has cooled significantly during the past 2 weeks. Much of the cooling is due to a countering (to the Gulf Stream) cold current flowing southwestward from just off Newfoundland. The ocean surface is several to 6C cooler than normal in this cool zone, most vividly indicated off the northern Mid-Atlantic Coast.
06/02/2025, 9:26 am EDT
A graph with red blue and white lines AI-generated content may be incorrect.

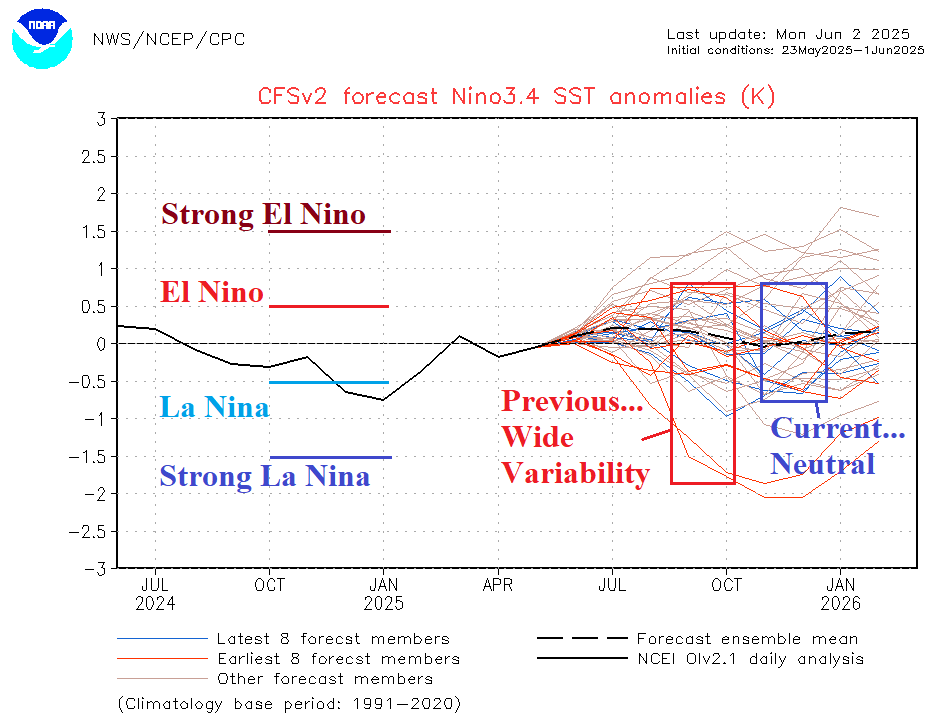
Wide Variation in ENSO Forecasts for Later 2025 Continue

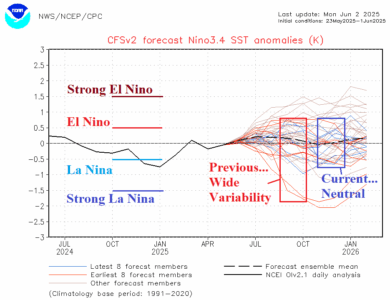
The NCEP CFS V2 Nino34 SSTA forecast continues to reveal a wide array of possible ENSO conditions for later this year. The latest 8 members of the ensemble forecast indicates a range of neutral ENSO to strong La Nina by early meteorological autumn.
06/02/2025, 5:51 am EDT
A map of the united states AI-generated content may be incorrect.

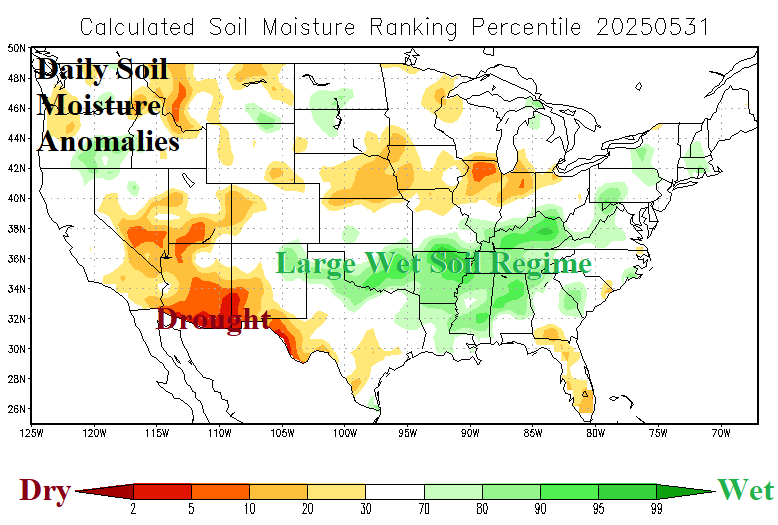
Do Large Areas of Wet Soils Affect Summertime Temperature Regimes?

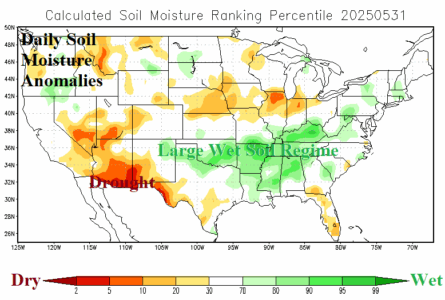
Vividly displayed to start meteorological summer is the influence a large area of wet soil conditions has on the prevailing weather pattern. The mid-to-late spring heavy rains have turned the Mid-south U.S. (and vicinity) soaking wet. The 15-day temperature anomaly outlook by AI Graph Cast projects a large area of suppressed heat risk across the wet soil region (and vicinity).
06/01/2025, 3:54 pm EDT
A map of the united states AI-generated content may be incorrect.

ECM ENS, AI Graph Cast, and U.S. AG Belt Rainfall

A notable difference between the AI Graph Cast and ECM ENS rainfall forecasts for North America during the past 30 days. The AI Graph Cast is too dry across the U.S. AG Belt while ECM ENS is too wet especially in Iowa.
06/01/2025, 9:38 am EDT
A map of the united states AI-generated content may be incorrect.

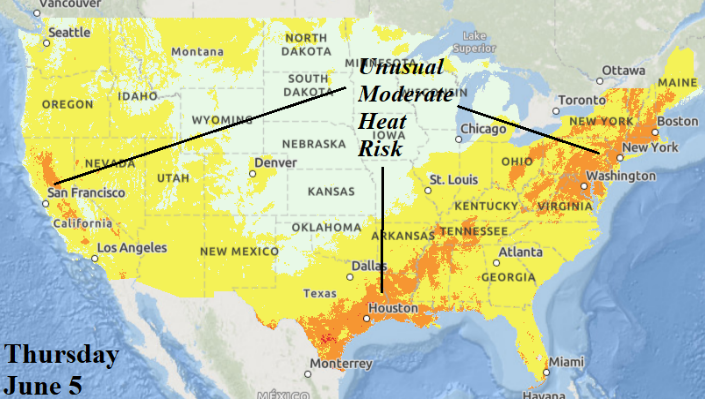
June 1 Arrives; Monitoring for Extreme Heat Begins

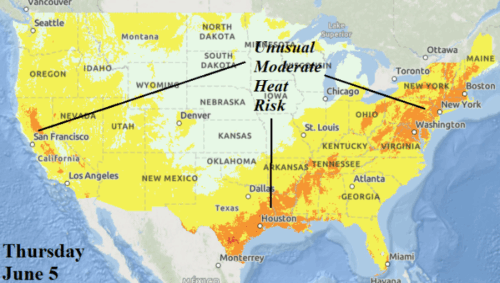
The NOAA risk of heat-related impacts forecast returns today. Climate Impact Company will use the most important potential hot weather days in daily reports. Today, highlighted are 3 days of important heat. The first is tomorrow when unusual moderate heat risk affects the Upper Midwest. The “unusual” moderate heat risk shifts across the Ohio Valley midweek and through the Northeast Corridor on Thursday. Low 90’s can occur in this zone. The highest heat risk (relative to normal) this week is on Saturday and targets the San Antonio to Houston area.
06/01/2025, 9:35 am EDT
A graph of a number of people AI-generated content may be incorrect.

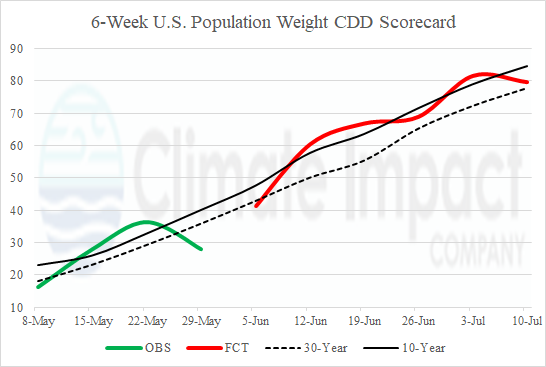
Climate Impact Company CDD Scorecard

A warmer (or cooler) than normal national climate DOES NOT necessarily equate to U.S. cooling demand. National CDD observations and forecasts are biased hotter or cooler by BOTH the temperature pattern and the population of the areas affected. Usually, anomalous heat in the PJM sector affects high national cooling demand (CDD’s) most effectively. Climate Impact Company initializes the U.S. 6-Week CDD Scorecard today.