


Latest News
07/30/2026, 5:03 am EDT

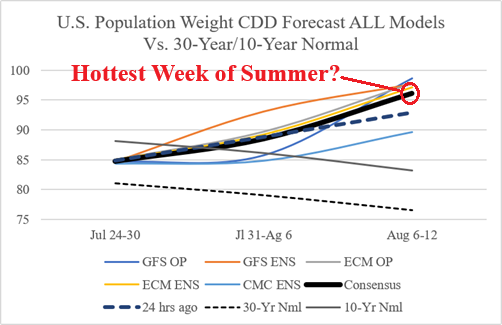
The U.S. population weight CDD forecast sizzles to a consensus forecast of 95 for the week of August 6-12. All models, except for CMC ENS, are agreeable. If so, August 6-12 will be the hottest week of summer 2026 across the U.S.
07/28/2026, 8:25 am EDT
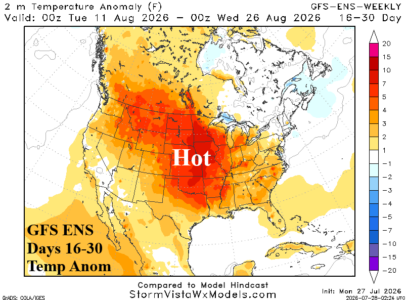
Showers and thundershowers for the Western U.S. Corn Belt this week. However, combining GFS and ECM renders a hot and dry pattern in the medium range. In the 16-30-day period, the potential for widespread heat and dryness could persist according to GFS ENS, the number 1 model for this time period during the past 30 days.
07/25/2026, 6:54 am EDT
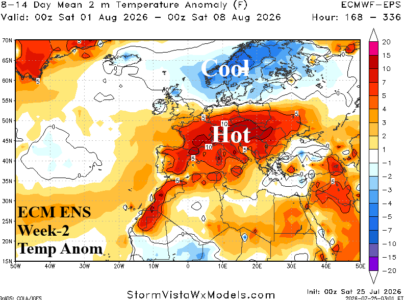
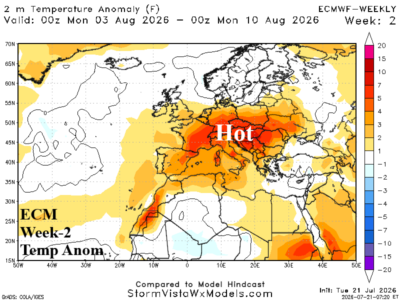
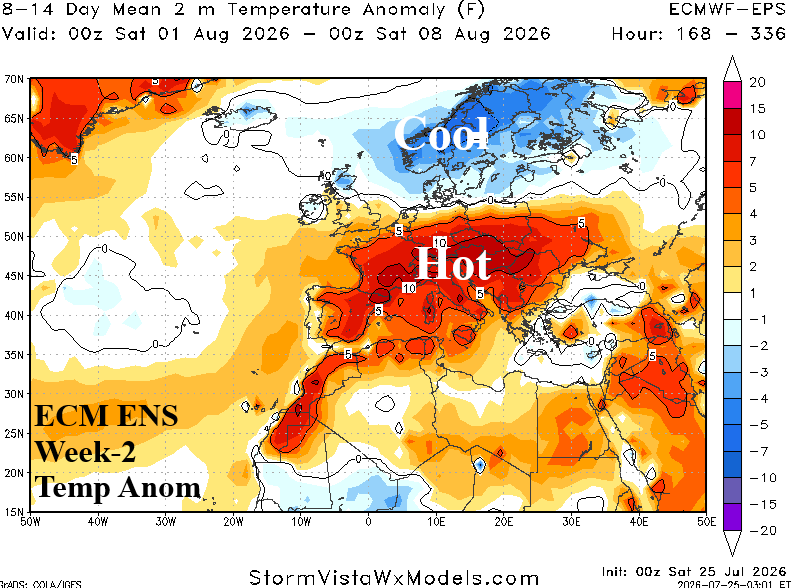
Another heatwave is developing for West and Central Europe. The extreme heat intensifies during late July/early August. Slowly, the heatwave shifts eastward and into Western Russia and the Black Sea region in August. Some relief follows for Western Europe (except Portugal/Span where heat is maintained).
07/23/2026, 4:06 am EDT
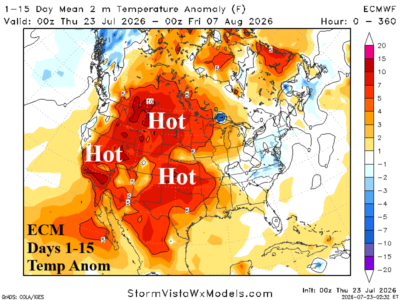
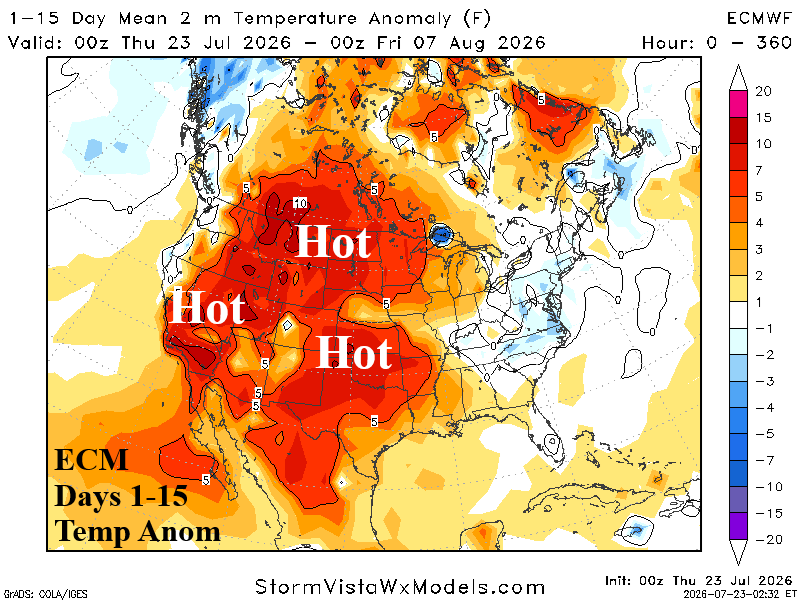
A dangerous late July/early August lengthy heatwave coupled with dry weather event is forecast for much of the Great Plains and Europe based on the latest ECMWF outlooks. Significant drought expansion and intensification will develop for both regions.
07/22/2026, 5:19 am EDT
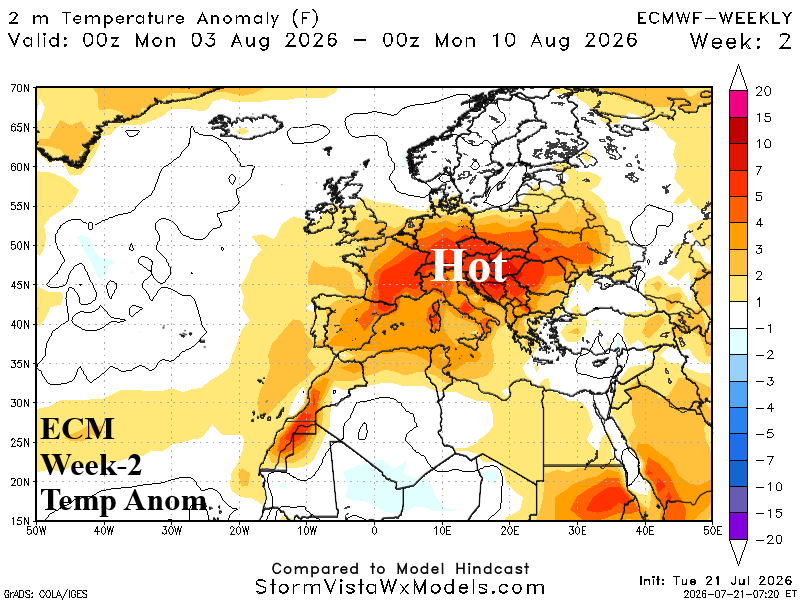
Soil moisture anomalies analysis reveals a large dry-to-drought scenario across Europe. The core of the drought is in France and Western Romania. The 10-day rainfall anomaly outlook by ECMWF indicates widespread drier than normal conditions. Week 2-4 forecasts rebuild Central Europe heat intensifying drought.
Climate Impact Company Chart of the Day
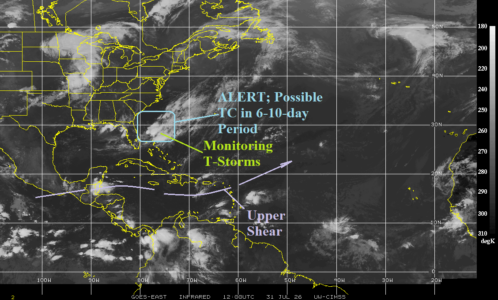
Watching Waters Near the Bahamas in the 6-10-Day Period
An area of thunderstorm activity across warmer than normal water rests northeast of the Bahamas. Development is not expected through early next week. However, a tropical wave is forecast to move into the waters east of the Bahamas and northwestward from there during the 6-10-day period possibly becoming a tropical cyclone.
Climate Impact Company Climate Diagnostics
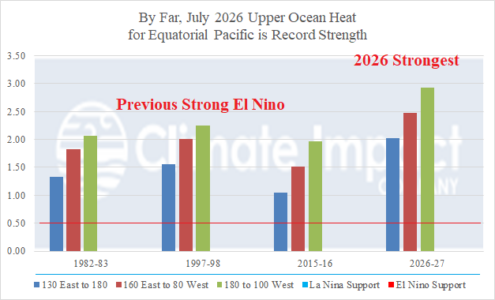
Strongest El Nino on Record Developing Now
The daily Nino12 SSTA is a buoyantly warm +4.04C which is frighteningly impressive! Weekly Nino12 SSTA exceeding +4.0C occurred only once, during the 1982-83 El Nino when +4.5 was observed in late June 1983 during the mature phase of that El Nino episode. Entering August, 2026-27 El Nino is in its infancy.