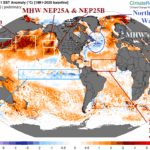
The Northern Hemisphere Upper Air Pattern Changes in September
08/28/2025, 9:48 am EDT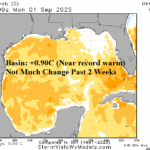
Overall, North Atlantic Cooler Than Recent Summer Seasons; But Gulf/Caribbean/MDR Very Warm!
09/02/2025, 2:46 pm EDT
Climate Impact Company U.S. CDD Outlook
Issued: Monday September 1, 2025
Headline: CDD’s crash in August.
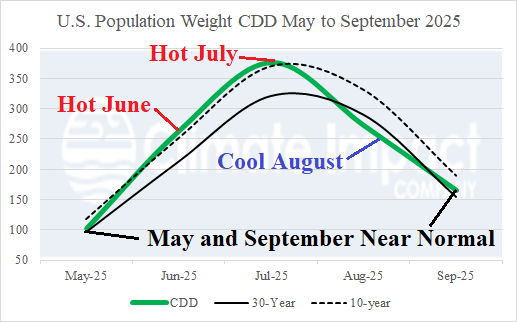
Fig. 1: U.S. population weight CDD observations and forecast for MAY-SEP 2025.
Discussion: The official U.S. population weight CDD for August 2025 from NOAA will be published in a few days. Climate Impact Company (CIC) projects 272 CDD for August (Fig. 1) which is cooler than the 30-year normal (290 CDD) and much cooler than the 10-year normal (332 CDD). The NOAA assessment is (more) likely cooler than the CIC estimate. The AUG-25 CDD total is 2nd coolest (for AUG) this century trailing only 2004 (254 CDD). The cool AUG-25, especially in the East U.S., was a surprise. Early-to-middle meteorological summer 2025 was hotter than the 10-year normal and countered by the cooler AUG-25. The coolest U.S. selected cities in AUG-25 according to observed CDD’s was in the Mid-Atlantic region including Washington, D.C. (342 CDD observed; 30-year normal 449 CDD), Baltimore (249 CDD observed; 30-year normal 423 CDD), and Richmond (279 CDD observed; 30-year normal 417 CDD).
The U.S. selected cities CDD forecast was the hottest with early July outlooks, biased by the hot June and anticipated hot July continuing into August. At that time, U.S. CDD forecasts for the 2025 warm season were near 115% of the 30-year normal, similar with last summer (Fig. 2). However, after the cool AUG-25, the 2025 warm season projection declines to 106-107% of the 30-year normal.
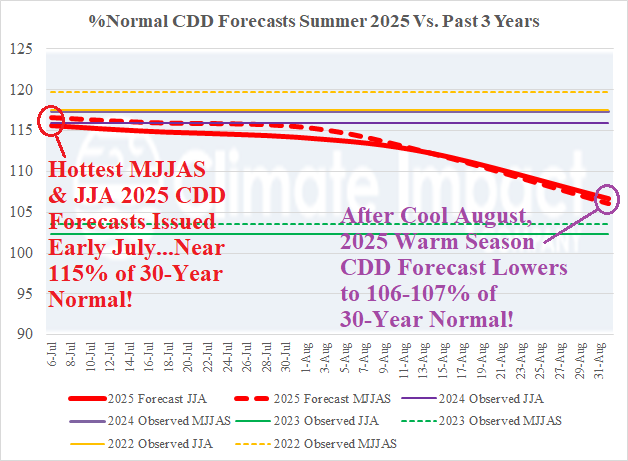
Fig. 2: Verified (MY-JUL) and Climate Impact Company projected (AUG-SEP) U.S. population weight CDD.