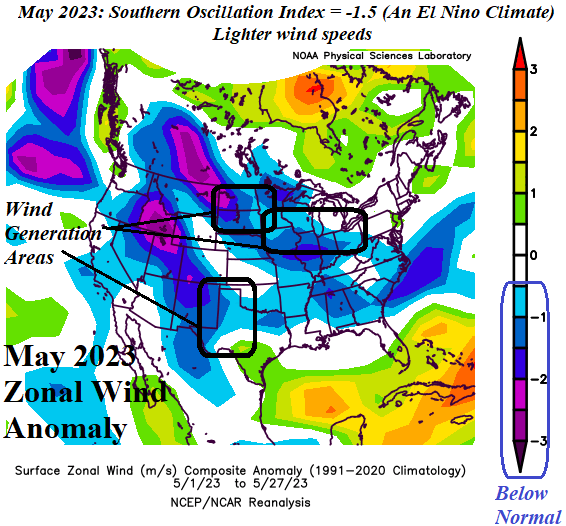
U.S. May 2023 Wind Speeds Below Normal Due to -SOI
05/30/2023, 8:20 am EDT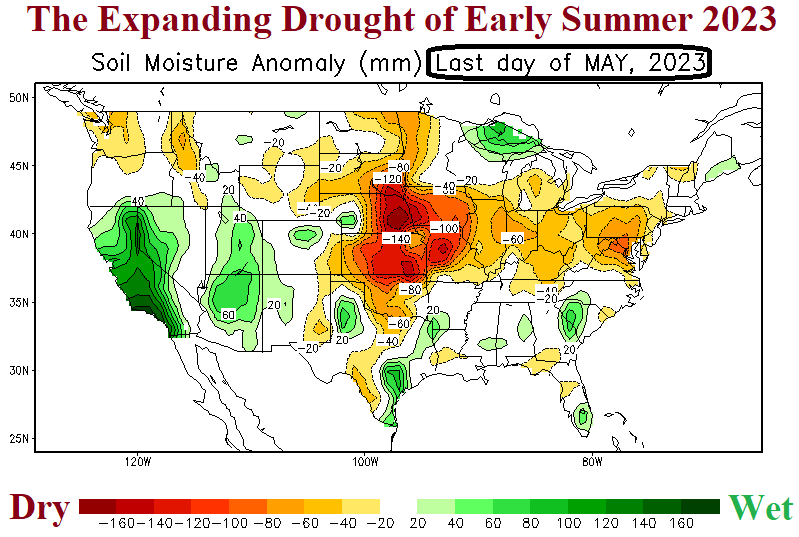
Cause of The Expanding May 2023 U.S. Drought
06/02/2023, 8:13 am EDT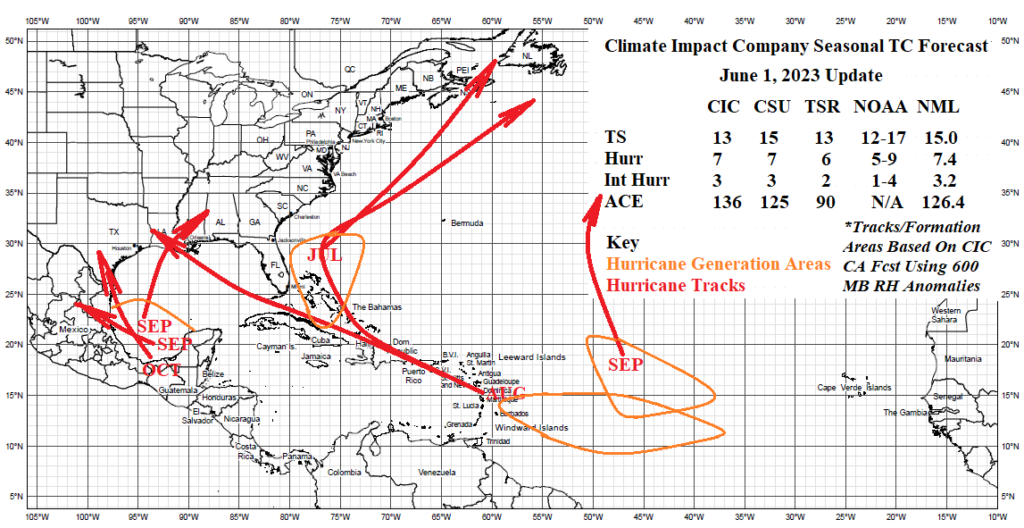
Highlight: Outlook becomes more dangerous to U.S. coastline.
Executive summary: The Climate Impact Company 2023 North Atlantic basin tropical cyclone season forecast is updated. The outlook maintains 7 hurricanes and 3 intense hurricanes while raising the number of tropical cyclones slightly from 12 to 13. However, a major increase in accumulated cyclone energy (ACE) index from 92 to 136 is indicated. The activity forecast is classified as “near normal”. The ACE index is moderately higher than normal due to a substantial increase in U.S. coastal threats. A slowly developing inhibiting effect of El Nino is forecast. However, the exceptionally warm North Atlantic over-rules El Nino and the 2023 activity forecast is markedly higher than an El Nino year.

Fig. 1: The Climate Impact Company seasonal activity forecast and projected formation areas/tracks of hurricanes for the 2023 North Atlantic basin TC season.
Forecast summary: Using a constructed analog to project 600 MB relative humidity anomalies, the July outlook indicates local risk of tropical cyclone formation near Puerto Rico and the western Gulf of Mexico (Fig. 2). However, the only significant storm, a potential hurricane, is born in warm waters off the Carolina coast and moves out to sea. In August, two powerful hurricanes are forecast each developing in the Eastern Caribbean Sea with one traveling to Louisiana and the other curling northeastward through the Bahamas (Fig. 3). In September, a total of 3 hurricanes are forecast. Two of the 3 are locally generated in warm waters of the western Gulf of Mexico quickly traveling inland (Fig. 4). Finally, an October system is projected out of the Bay of Campeche and toward the South Texas coastline, a rare track for late in the season (Fig. 5).
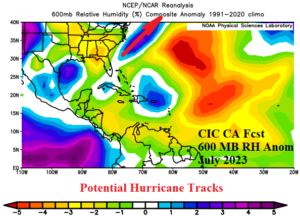
Fig. 2: The CIC-CA 600 MB relative humidity forecast across the North Atlantic tropics and subtropics to determine the most likely path of hurricanes in July 2023.
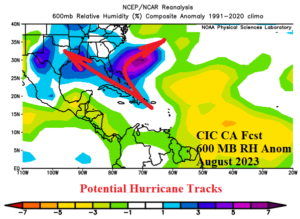
Fig. 3: The CIC-CA 600 MB relative humidity forecast across the North Atlantic tropics and subtropics to determine the most likely path of hurricanes in August 2023.
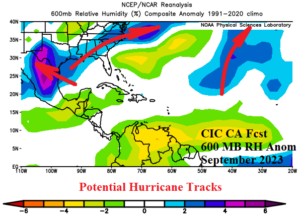
Fig. 4: The CIC-CA 600 MB relative humidity forecast across the North Atlantic tropics and subtropics to determine the most likely path of hurricanes in September 2023.
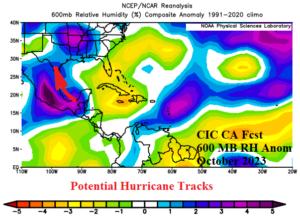
Fig. 5: The CIC-CA 600 MB relative humidity forecast across the North Atlantic tropics and subtropics to determine the most path of hurricanes in October 2023.
Climate discussion: The primary influences forecasting the 2023 North Atlantic tropical cyclone season activity forecast update are El Nino southern oscillation (ENSO) phase, North Atlantic sea-surface temperature anomalies (SSTA), tropical Africa rainfall projection, and quasi-biennial oscillation (QBO). ENSO phase is well-correlated with the amount of upper-level shear across the tropical North Atlantic while North Atlantic SSTA is helpful to determine storm intensity. The strength of tropical waves moving into the main development region (MDR) for hurricanes in the central and eastern tropical North Atlantic is determined by the amount of anomalous rainfall in tropical Africa. Upper-level ventilation to determine storm formation and intensity potential utilizes the QBO phase.
The SSTA regime to start the North Atlantic tropical cyclone season is unusual. In the Northeast/East Pacific basin El Nino warming has generated in the far eastern equatorial Pacific while westward across the east-central/central equatorial Pacific SSTA are near normal. Helping to prevent the westward expansion of anomalous warm water in the equatorial region to spawn an official onset of El Nino is the inflow of cooler waters riding southwestward via the California Current to the south and southwest of Hawaii and into the tropics. The cool waters off west and southwest of California and Baja California are characteristic of the lingering cool phase of the Pacific decadal oscillation (-PDO). Meanwhile the semi-permanent marine heat wave (MHW) north and northeast of Hawaii is slightly weaker but shifting toward the Northwest U.S. and Southwest Canada coastline. The MHW needs to strengthen and shift east and reach the North America West Coast to guarantee El Nino with intensity.
In the North Atlantic, SSTA is exceptionally warm. Regions of warmth include the Gulf of Mexico, tropical and subtropical altitudes, and associated with a new MHW off the northwest coast of Africa/West Coast of Europe. The semi-permanent North Atlantic warm hole (NAWH) has shifted farther west so far in 2023 and is located east of New England and south of Southeast Canada. The warm tropical and subtropical SSTA are exceptional for this time of year. The westward shift of the NAWH was not expected and has resulted in a cool East U.S. and dry Midwest U.S. mid-to-late spring. The NAWH regime will help determine where the Bermuda High sets-up. If the NAWH maintains the current location, the Bermuda High will split with one center near the Azores and another in the vicinity of Florida. If the NAWH shifts eastward which is expected, the Bermuda High will broaden from the Azores toward the Bahamas.
The tropical Africa rainfall anomalies are forecast above normal for this year suggesting tropical waves in the outer North Atlantic are stronger than normal and more susceptible to becoming tropical cyclones. The QBO phase forecast is diminishing strength of the positive phase which slightly elevates tropical cyclone risk in the deep tropics.
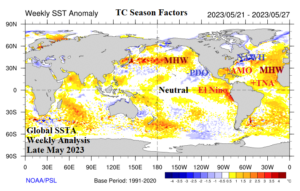
Fig. 6: Current global SSTA analysis and annotated regions pertinent to the North Atlantic tropical cyclone season forecast. Note the warm North Atlantic and the attempt at El Nino development in the East Pacific.
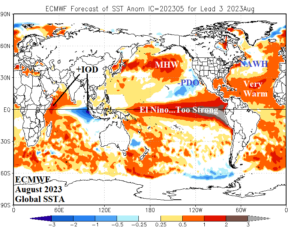
Fig. 7: ECMWF global SSTA forecast for August 2023 and the annotated regions of influence on the North Atlantic tropical cyclone season. The El Nino forecast is too strong, but the warmth of the North Atlantic projection is likely correct.
Methodology discussion: The analog used to produce both the updated seasonal activity forecast and monthly most likely generation areas and forward tracks is based on the forecast factors mentioned above (Table 1). The gradual warming of the Nino34 region while a robust warm Nino12 regime is present during tropical cyclone season is relatively rare and approximated (since 1995) only during 2006 (marginally) and 2014 for forecast purposes. A very warm North Atlantic SSTA including the tropics during tropical cyclone season is somewhat common occurring in 2020, 2017, 2016, 2012, 2010, 2005, 2004, 2003, 1998 and 1995. Only 2006 and 2004 had (any) El Nino characteristics for forecast purposes. The NAWH regime active since 2014 produced tropical cyclone seasons near 2023 expectations in 2020, 2019, and 2017. La Nina was present in 2020 and 2017 leaving only 2019 as an analog year for forecast purposes. A wet east/central tropical Africa regime during JUL-SEP since 1995 occurred on 10 occasions however only 2012 and 2018 occurred during non-La Nina years. Similarities in the QBO forecast were observed in 2017. Given the weighty influence on the tropical cyclone season of ENSO and North Atlantic SSTA, those analog years are weighted twice, and the remaining analog years are weighted once.
| N34 | N12 | AMO | TNA | NAWH | Africa | QBO | |
| JUN | Neutral | Very Warm | Very Warm | Very Warm | NW Atlantic | Wet | Positive |
| JUL | Neutral | Very Warm | Very Warm | Very Warm | NW Atlantic | Wet | Positive |
| AUG | Warm | Very Warm | Very Warm | Very Warm | North-Central | Wet | Positive |
| SEP | Warm | Very Warm | Very Warm | Warm | North-Central | Wet | Weak Positive |
| OCT | Warm | Very Warm | Very Warm | Warm | North-Central | Wet | Weak Positive |
Table 1: Summary of climate factors used to produce the 2023 North Atlantic basin tropical cyclone season forecast update.
Forecast: The forecast tabulation indicates a wide range of possibilities due to the uncertainty of ENSO (Table 2). However, the weighted average of all analog years indicates a slight increase over the previous forecast as tropical storm number increases from 12 to 13 while hurricanes and major hurricanes remain at 7 and 3 respectively but ACE index increases dramatically from 92 to 136 (Table 3). The seasonal forecast is classified “near normal” but certainly more active than a typical El Nino year. Thematic with all seasonal forecasts and their updates is a slight increase in activity due to the delayed El Nino and the warm North Atlantic (Table 4).
| Analog Year | Weighting | Tropical Storms | Hurricanes | Intense Hurricanes | ACE Index |
| 2004 | 2 | 15 | 9 | 6 | 225 |
| 2006 | 2 | 10 | 5 | 2 | 79 |
| 2012 | 1 | 19 | 10 | 2 | 133 |
| 2014 | 2 | 8 | 6 | 2 | 67 |
| 2017 | 1 | 17 | 10 | 6 | 225 |
| 2018 | 1 | 15 | 8 | 2 | 132 |
| 2019 | 1 | 18 | 6 | 3 | 132 |
| Average | 12.5 | 7.4 | 3.3 | 136.4 | |
| Forecast | 13 | 7 | 3 | 136 |
Table 2: The weighted analog years and their tropical cyclone activity is averaged to produce the updated seasonal forecast for 2023.
The 2023 seasonal activity forecast has similarities to last year (Table 2). The outlook is somewhat less active than the past 7 years. The outlook is also less than
| Tropical Storms | Hurricanes | Intense Hurricanes | ACE Index | |
| 6/1/23 | 13 | 7 | 3 | 136 |
| 3/31/23 | 12 | 7 | 3 | 92 |
| Last Year | 14 | 8 | 2 | 95 |
| Last 7 Years | 18.6 | 8.4 | 3.7 | 150.0 |
| 15-Year | 16.3 | 7.4 | 3.2 | 122.5 |
| 30-Year | 15.0 | 7.4 | 3.2 | 126.4 |
| 50-Year | 12.7 | 6.5 | 2.6 | 103.6 |
Table 3: The 2023 North Atlantic basin seasonal tropical cyclone activity forecast compared to various climatology and previous outlook.
| Tropical Storms | Hurricanes | Intense Hurricanes | ACE Index | |
| CIC | 13 | 7 | 3 | 136 |
| CSU | 15 | 7 | 3 | 125 |
| TSR/U.K. | 13 | 6 | 2 | 90 |
| NOAA | 12-17 | 5-9 | 1-4 | N/A |
| 30-Year | 15.0 | 7.4 | 3.2 | 126.4 |
Table 4: The 2023 North Atlantic basin seasonal tropical cyclone activity forecast by all leading providers compared to the 30-year normal.